Newest
Topics:
For the latest news, see the NEWEST TOPICS page.
Google is too dumb to let me put the list of news in this column and falsely claims that all my pages are self-duplicates.
Google-NONSENSE
Google's so-called "Artificial Intelligence" is an abuse of the concept of intelligence!
Geochemical exploration using palaeo-hydrothermal
fluids
Kingsley Burlinson
A presentation at the SGA conference, Uppsala,
Sweden, August 2013
Many mineral deposits are formed by hydrothermal processes. To
explore for these we make extensive use of geophysics and
geochemistry but rarely do we use the fluids themselves in
exploration, despite the fact these fluids are preserved as fluid
inclusions. With carefully chosen analytical methods we can easily
derive very useful information from the fluids themselves to use
in exploration for hydrothermal mineral deposits.
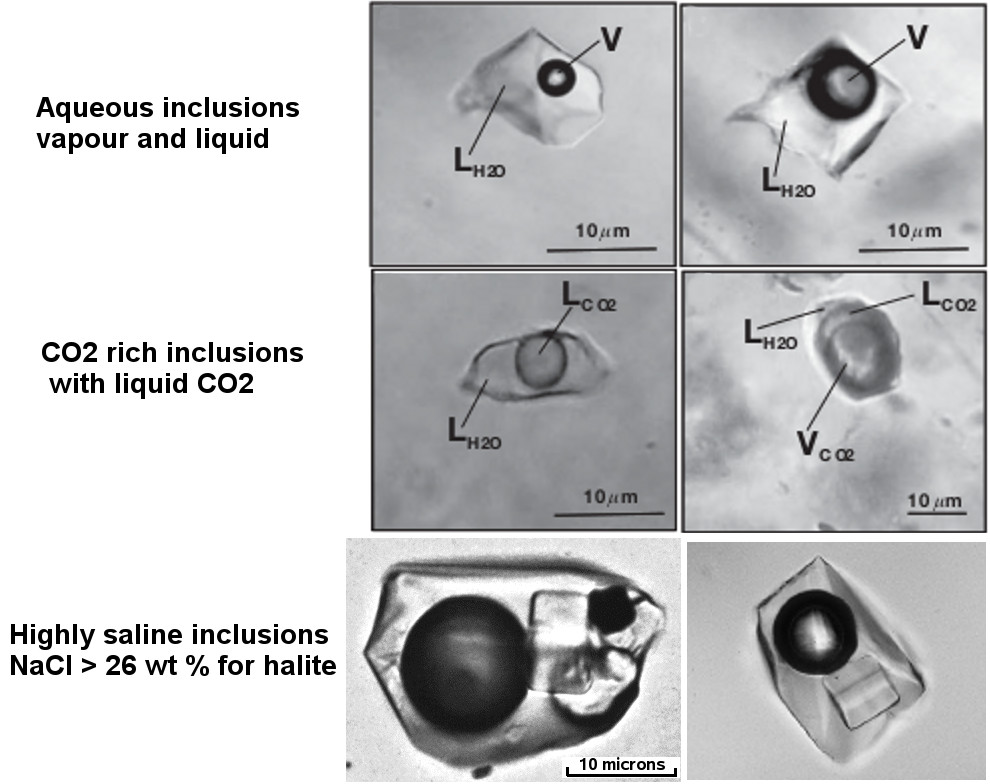
Some typical inclusions trapping the palaeo-hydrothermal fluids
are shown here.
Aqueous inclusions are very common, but not usually useful
for mineral exploration.
CO2 rich fluid inclusions are frequently
associated with mesothermal gold deposits and are often a good
indication of deep-sourced fluids which may have transported and
deposited gold and other economic minerals.
Highly saline inclusions with a daughter crystal of halite
are common in the core zone of porphyry copper systems, or other
intrusion related deposits.
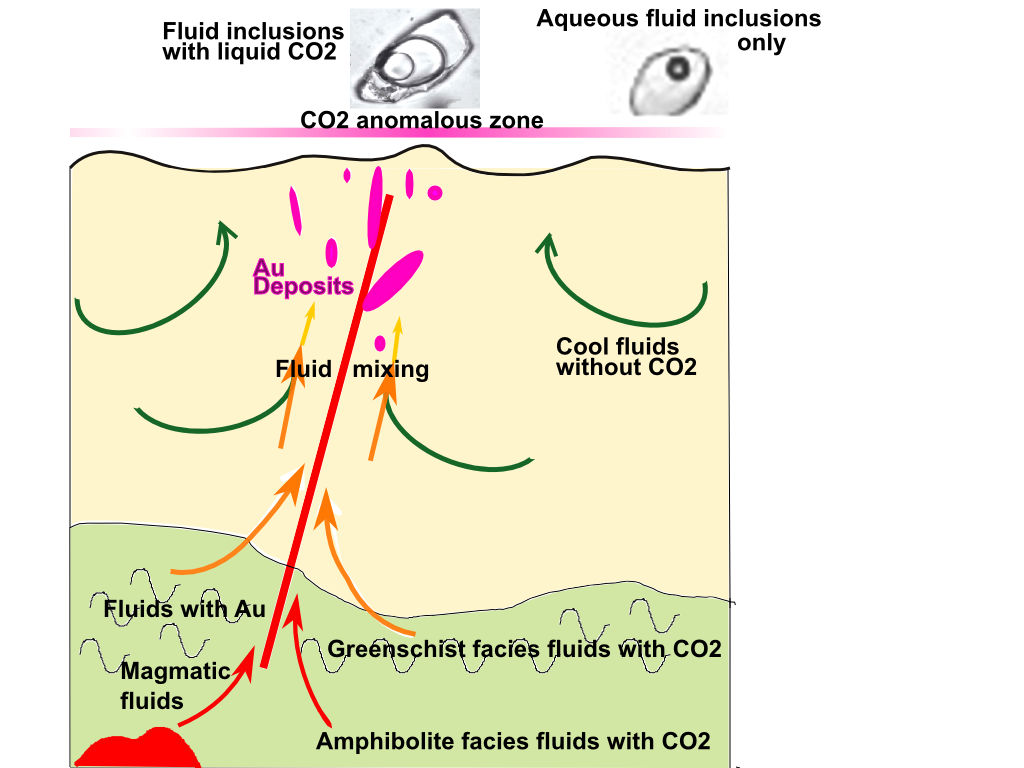
This model for the formation of mesothermal gold deposits shows
that CO2 rich fluids are often derived from metamorphic
de-volatilisation. These fluids may have dissolved gold from the
source region. As the fluids ascend to the surface their
temperature drops and CO2 may ex-solve as the pressure
decreases and these changes can lead to deposition of the gold in
solution to form a deposit. The CO2 also buffers the
fluid in a pH range which favours the solution and transport of
gold. (Phillips & Evans)
Hence the presence of CO2 rich fluids is a good
exploration guide. Using CO2 as an exploration guide
provides a larger and more consistent target than trying to use
geochemical analyses or mineralogical zoning. It is also
advantageous in the detection of blind deposits which are
otherwise difficult to locate.
Traditional microthermometric methods to determine CO2
contents are slow and tedious and usually require petrographic
sections. But for exploration we can use the baro-acoustic
decrepitation method to easily and quickly determine approximate CO2
contents. This method uses a computerised instrument and
is completely objective as it avoids the need for visual observation
with its potential for bias. Analyses are done on crushed grain
samples and there is no need to prepare petrographic sections. The
analysis is rapid and takes just 30 minutes per sample and so large
numbers of samples from a spatial array can be analysed in the same
manner than geochemical surveys are undertaken. The presence of CO2
in the sample is shown by a distinctive peak in the baro-acoustic
decrepigram result.
This is the model 105 decrepitation instrument in current use.
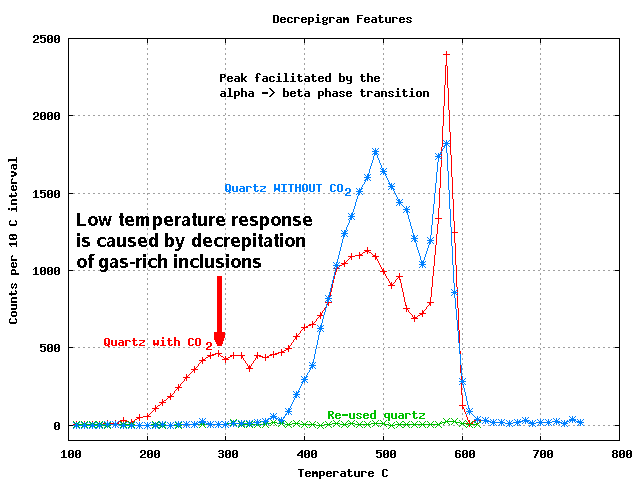
The analysis result is a histogram of counts versus temperature.
This shows the decrepitation curve for 2 different quartz samples,
one (blue) without CO2 and the other (red) with CO2
rich fluid inclusions. The CO2 causes a peak at unusually
low temperature which is characteristic of the presence of CO2
and the peak amplitude is an approximate estimate of the CO2
amount. (Other non-condensible gases such as CH4 also
contribute to this low temperature decrepitation peak.) The green
result is an analysis of quartz that has previously been analysed.
It shows no response at all and confirms that the measurements are
of fluid inclusions and not crystallographic effects. Fluid
inclusion decrepitation is destructive and hence irreversible, but
many crystallographic transitions are reversible and would also be
detected on a re-analysis of the previously analysed quartz.
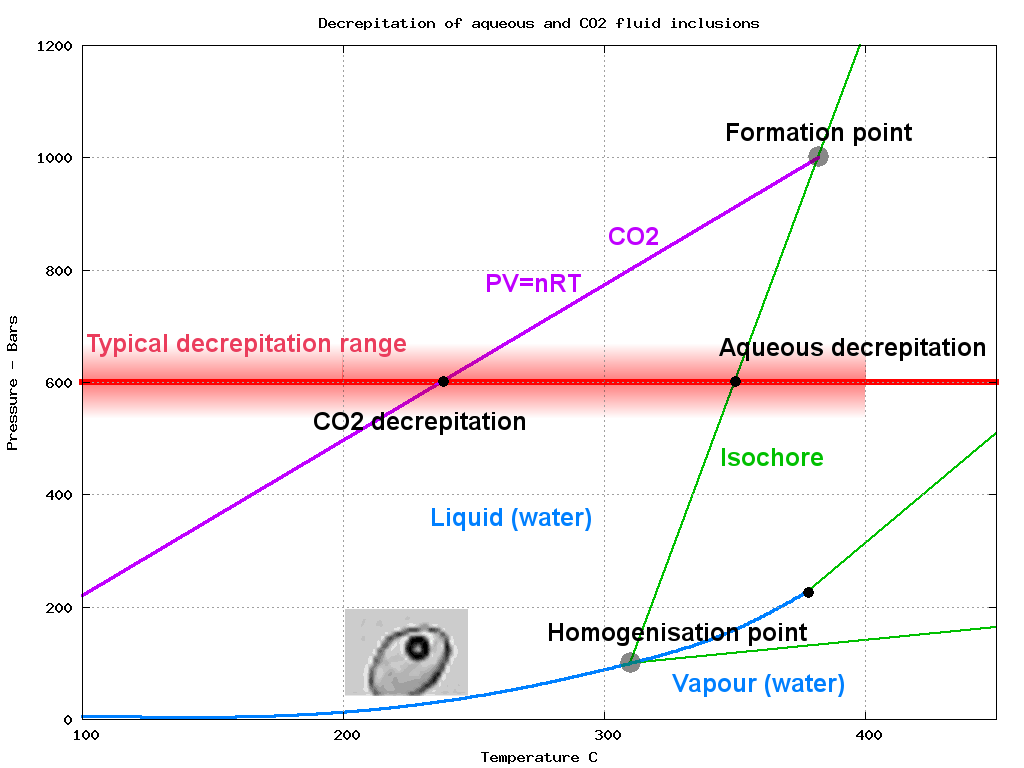
Using this P-T graph, we can easily explain why CO2 rich
inclusions cause a distinctive low temperature peak on the
decrepitation results.
Consider 2 inclusions formed at the "formation point" of 380 C and
1000 bars, one with only water and the other with only CO2.
At room temperature the aqueous inclusion will have condensed to a
liquid with a vapour bubble. As it is heated the internal pressure
(blue line) does not rise much until after the liquid expands
and eliminates the vapour bubble at the "homogenisation point". The
pressure will then rise quickly with further heating, following the
green isochore line until it decrepitates near 350 C.
In contrast, the CO2 inclusion does not condense and
remains as a gas phase. When heated the internal pressure is
determined from the gas law equation (PV=nRT) and rises linearly as
shown by the magenta line. Decrepitation occurs at the much lower
temperature of 240 C, giving the characteristic low temperature
decrepitation peak due to gas rich inclusions.
The baro-acoustic decrepitation method exploits this behaviour to
provide an easy way to determine the CO2 content of
inclusion fluids.
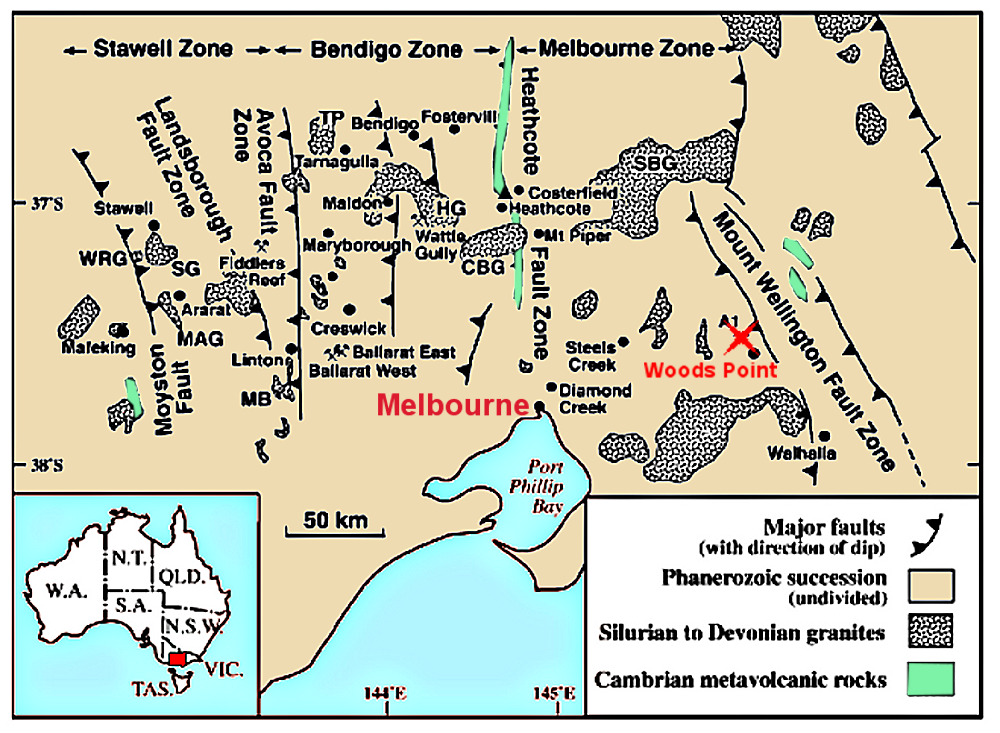
Using CO2 in gold exploration at Woods Point, Vic.,
Australia
The Morning Star mine at Woods Point is about 120 Km north-east
of Melbourne. It has produced over 900,000 oz of gold since
discovery in 1861.
The gold mineralisation is associated with the intrusion of a
late Devonian aged dyke swarm within the Silurian and early
Devonian sedimentary host rocks.
(Map modified from "A geochronological framework for orogenic gold
mineralisation in central Victoria, Australia" by Bierlein, Arne,
Foster & Reynolds, Mineralium Deposita (2001) V36:741-767).
KEY: Major intrusives are: WRG White Rabbit Granite; SG
Stawell Granite; MAG Mt Ararat Granite; MB Mt Bute; CBG
Cobaw/Pyalong Granite; TP Tarnagulla Pluton; HG Harcourt Granite;
SBG Strathbogie Granite
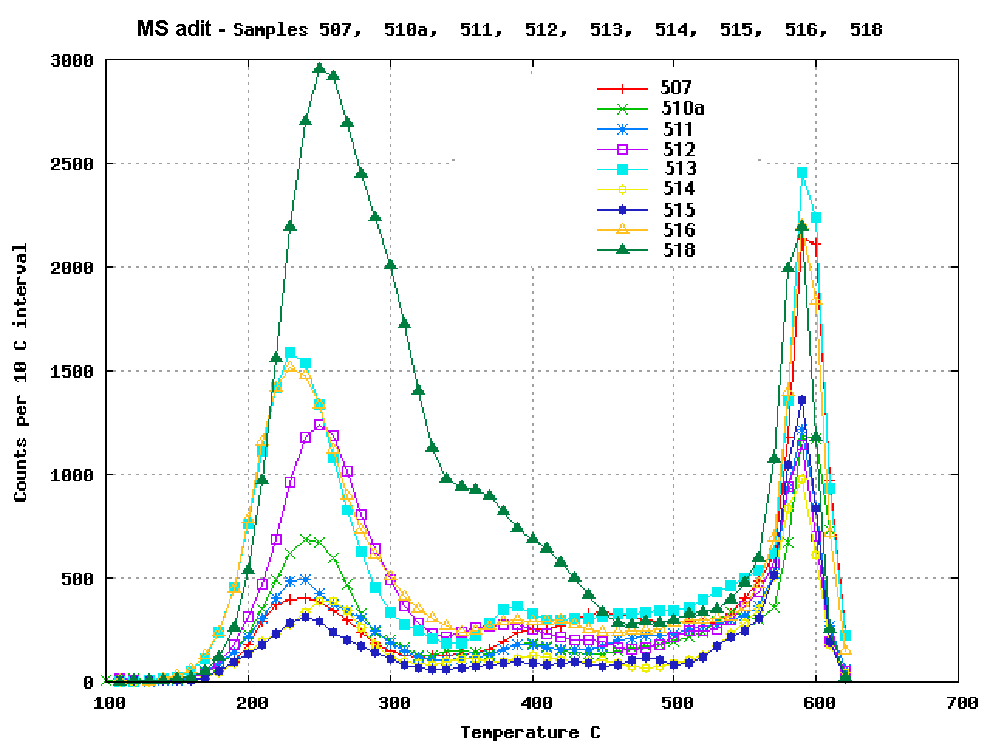
Samples from the Morning Star mine and adjacent areas were collected
by Caitlyn Hoggart as part of her thesis work. 34 samples were
analysed by baro-acoustic decrepitation.
Most samples had a prominent low temperature decrepitation peak
indicating the presence of CO2 rich fluid inclusions as
seen here in samples from the Morning Star mine adit.
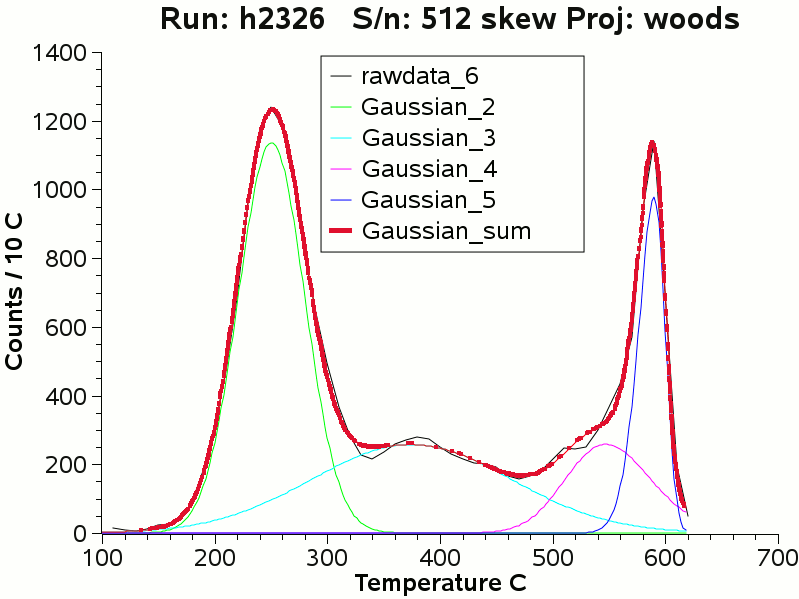
Each sample result curve was de-convoluted into component
skewed-gaussian curves as
described here.
This mathematical procedure provides consistent and reliable values
for the temperature and height of the decrepitation peaks in each
sample to facilitate inter-sample comparisons.
This is an example of the results of de-convolution of sample 512
into 4 component curves. The black line (frequently hidden beneath
the red line) is the raw data while the red line is the
mathematically calculated best fit to the raw data.
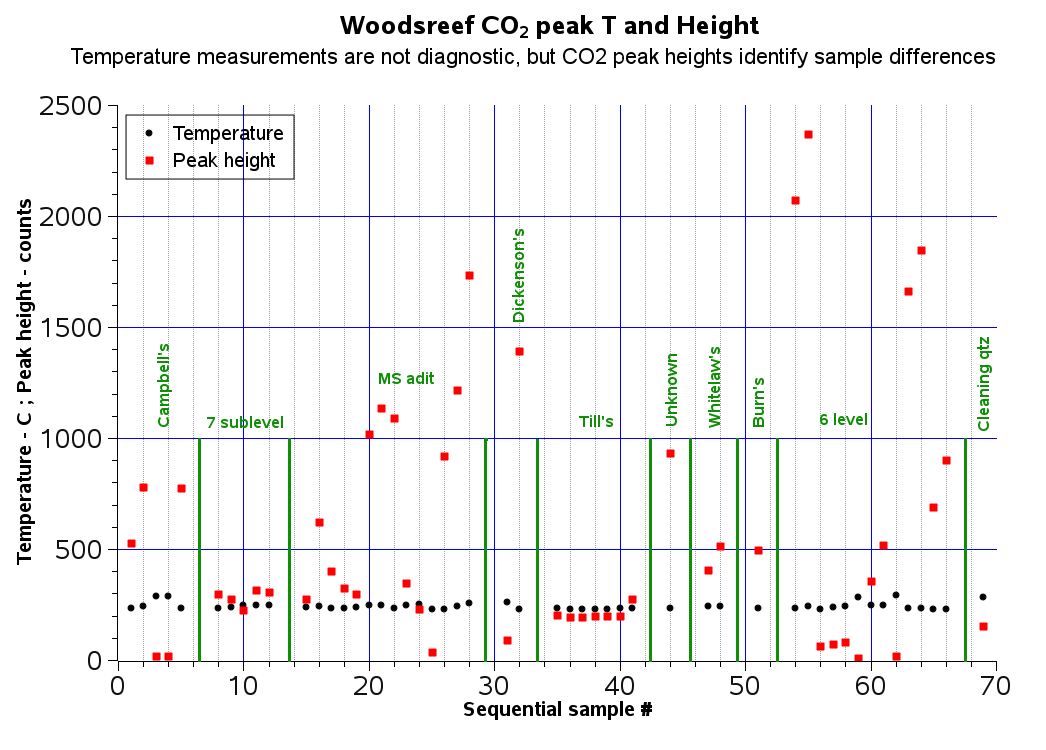
Comparison of all the CO2 peak data from all the samples
shows that the temperature does not vary much across the field. But
there are significant and potentially informative variations in the
amplitude of the CO2 peak, reflecting variations in the
abundance of CO2 rich inclusion populations in each
sample.
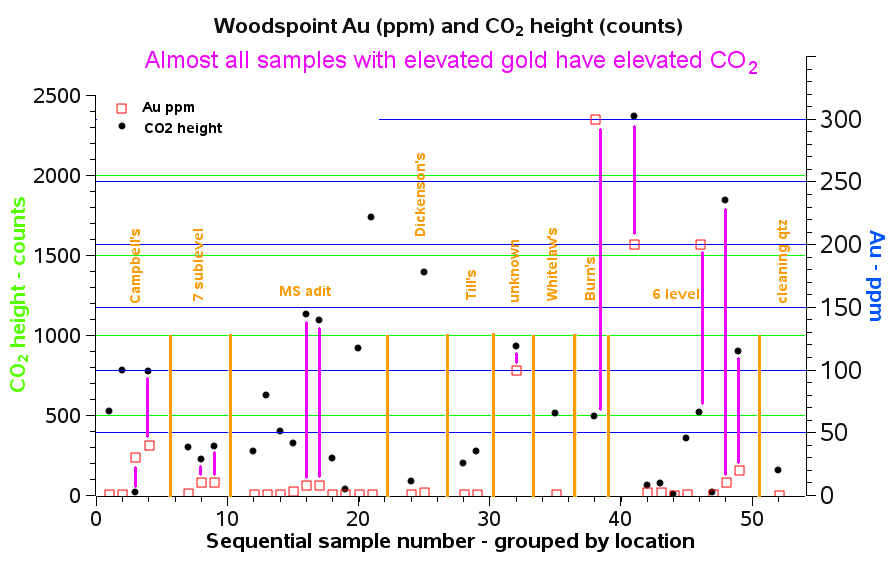
This plot compares the gold analyses with the low temperature CO2
caused decrepitation peak height. All except one sample
(sequential sample #3 in this plot) containing more than 10 ppm gold
had a high CO2 peak. (The magenta lines connect all the
above background Au results and their CO2 analysis.)
Because CO2 rich fluid inclusions are widely
dispersed around mineralisation they form a large anomaly
target. Exploration for these fluids is better than relying on gold
results which are less widely dispersed and often erratic due to
nugget effect irregularities. But this study is incomplete due to
the lack of distal unmineralised comparison samples.
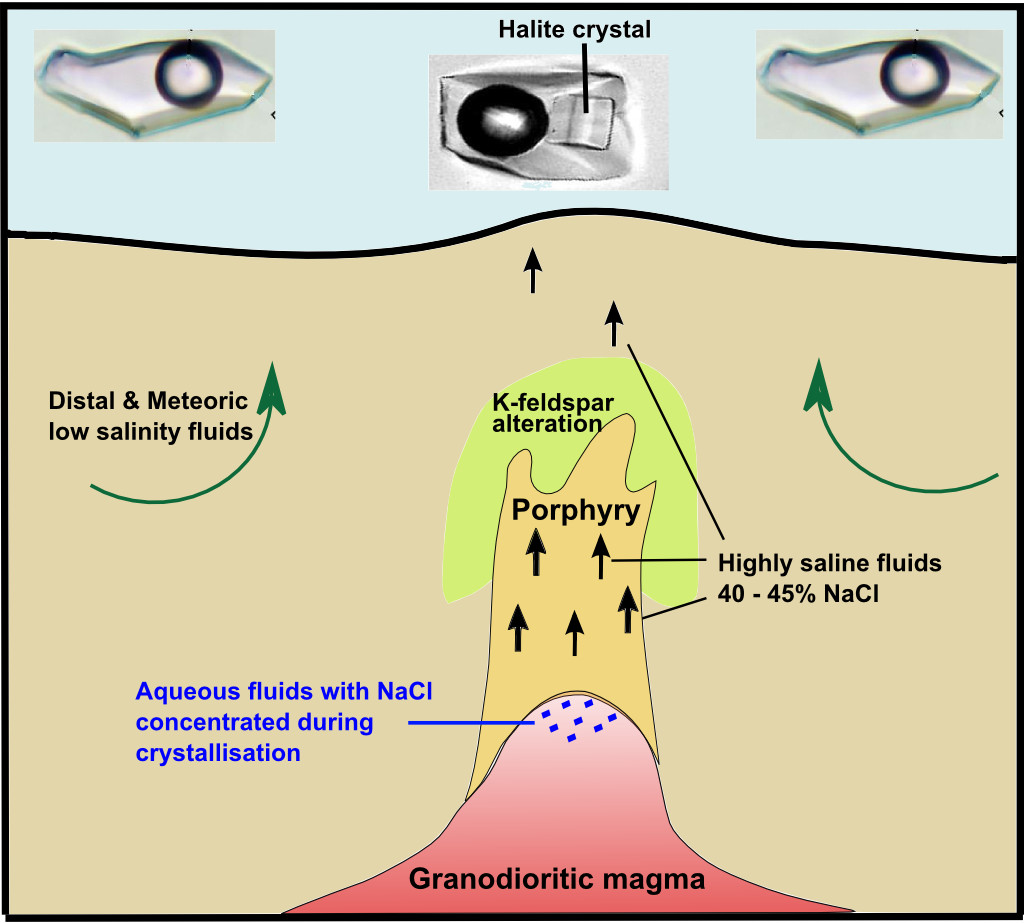
Saline fluids in porphyry copper and intrusion related systems
The relationship between highly saline fluids and the core zone of
porphyry copper systems has been widely documented, including this old summary from
1981. As the parent intrusion crystallizes, incompatible
minerals concentrate in the last stage residual aqueous fluids. Salt
also concentrates in these last stage fluids, which then form the
economically interesting mineral deposits as they migrate away from
the intrusion. These saline fluids can be used to identify
potentially mineralised zones as the saline fluids are dispersed
more widely than the mineralization itself. They can be used to
vector in towards the core zone of the intrusion and its associated
mineralisation.
Although measuring precise salinities of fluid inclusions can be
complicated and slow, such detailed measurements are not necessary.
In an exploration programme it is sufficient to merely observe the
presence of daughter halite crystals in the fluid inclusions as
these form when the fluid salinity exceeds NaCl saturation of about
26 wt. %. Quick and easy observations are adequate to recognize
these important saline fluids which directly indicate the proximity
to the potentially mineralised core zone of the hydrothermal fluid
system.
This depositional model diagram shows the relationship between an
intrusive magma and the saline fluids which concentrate in its late
stage core fluids. Saline fluid inclusions occur above and
peripheral to the economically mineralised zones and assist in
locating the mineralised core zone and also blind deposits.
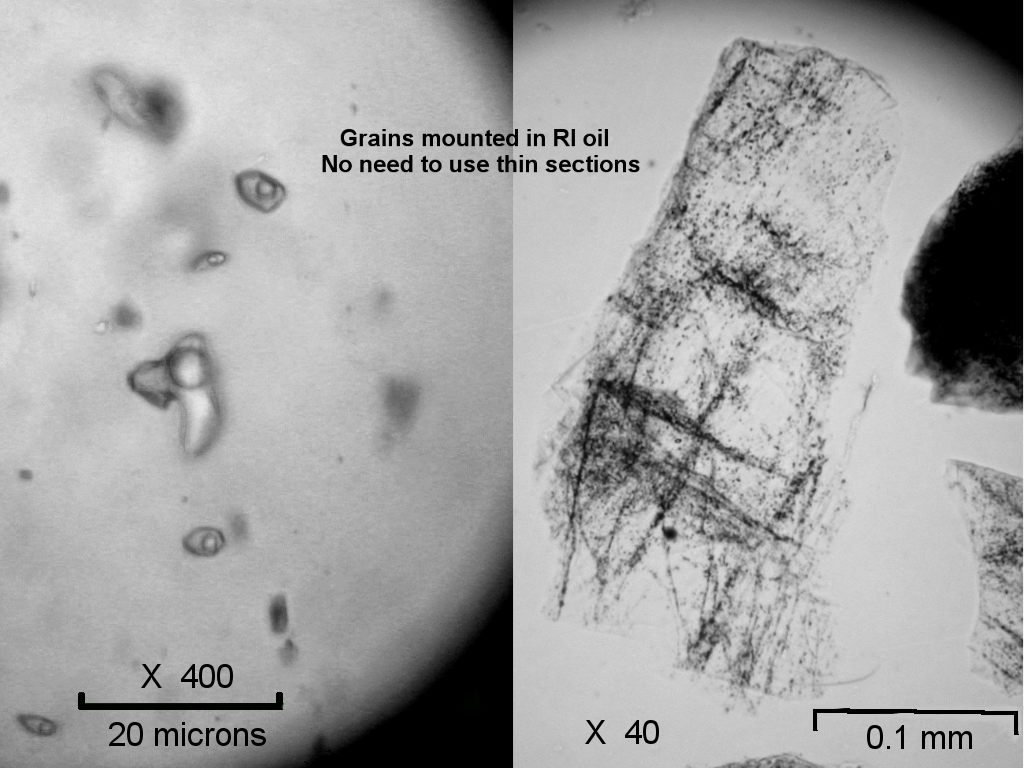
It is very easy to make these observations and it is not even
necessary to prepare petrographic sections or use a polarizing
microscope. Crushed and sized grains (approx <420 microns [40
mesh] and >200 microns [80 mesh]) immersed in an oil with the
same refractive index as quartz (clove oil) are quite suitable for
observation on a transmitted light microscope with magnification of
about 600 (40* objective, 15* eyepiece).
This image shows fluid inclusions in crushed grains in oil. The
right hand image is at low magnification of about 60 times and the
numerous dark spots are abundant fluid inclusions, each about 5 to
20 microns across. At high magnification you can easily see the
contents of the inclusions as in the left hand image. (Unfortunately
there are no halite daughter crystals in this image as I do not have
a suitable photograph.)
Using fluid temperature measurements in mineral exploration
Academic fluid inclusion studies invariably measure numerous fluid
inclusion homogenisation temperatures to determine the temperature
of formation of the system. Such studies invariably record great
complexity with varying types of fluid inclusions emplaced at
different stages (primary, pseudo-secondary, secondary) in mineral
host grains of differing paragenesis. Temperatures are usually
painstakingly recorded with 0.1 C resolutions. The resulting studies
are extremely detailed, but curiously they almost always summarise
the temperatures as very broadly averaged histograms with very poor
temperature resolution. The end result of these slow and tedious
studies is the realisation that mineralised quartz veins form in
similar or identical temperature ranges as barren veins and that
temperature measurements are consequently of little or no use in an
exploration context.
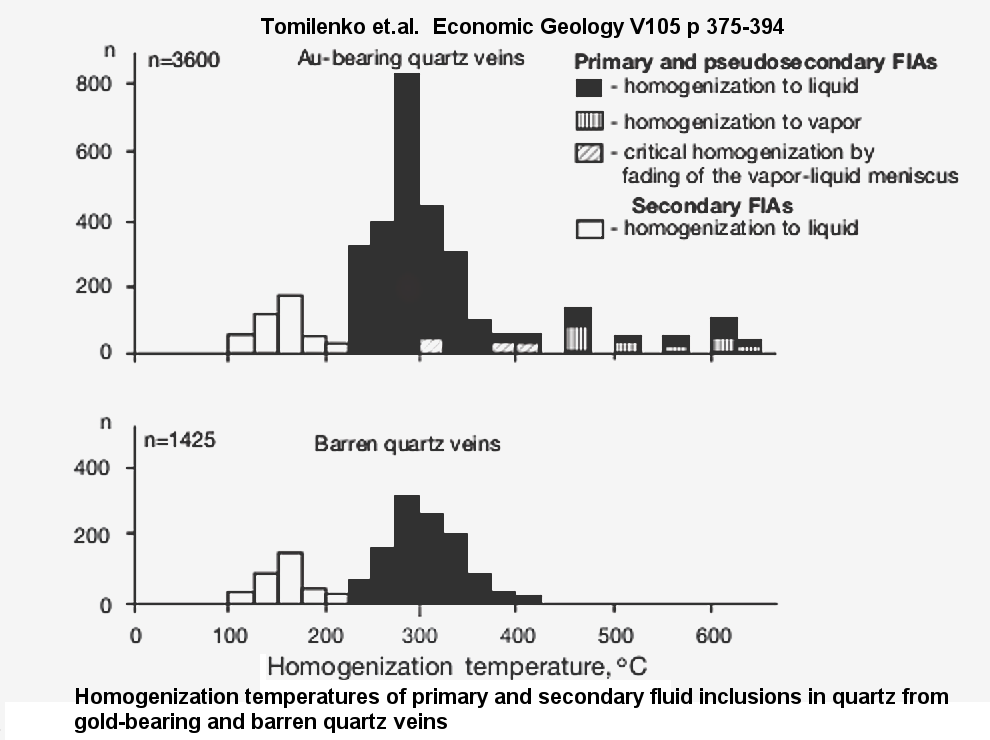
In this astonishingly comprehensive
study, Tomilenko et.al measured the temperatures of 5025
quartz samples from both mineralised and barren quartz veins in the
Sovetskoye gold deposit, Siberia, Russia. Their summary histograms
show that there is no significant temperature difference between
mineralised and barren quartz veins.
Measurements of fluid inclusion temperatures do not provide useful
information to guide regional exploration. Such data are primarily
of use in forensic studies of the genesis of deposits that have
already been discovered.
However, fluid inclusion temperatures may be useful in carefully
controlled studies of an individual deposit to outline zonation.
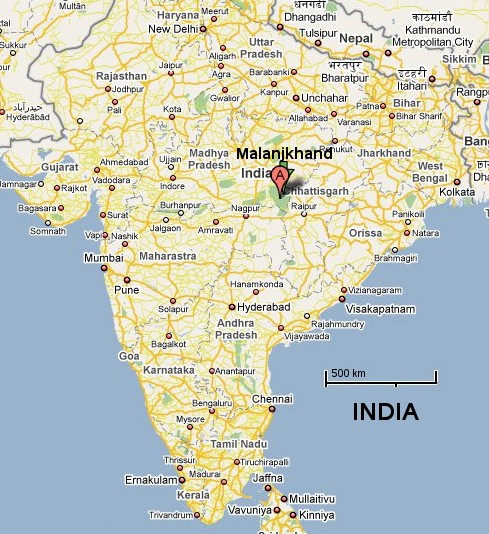
Temperature zonation within the Malanjkhand copper mine, India
Malanjkhand is a large open pit copper mine in central India
Although sometimes classified as a "porphyry copper" type deposit,
quartz is the dominant accessory mineral (almost the exclusive
accessory mineral) in the ore zone and this is quite unlike typical
porphyry copper deposits elsewhere. But the abundance of quartz
allows detailed fluid studies throughout the pit.
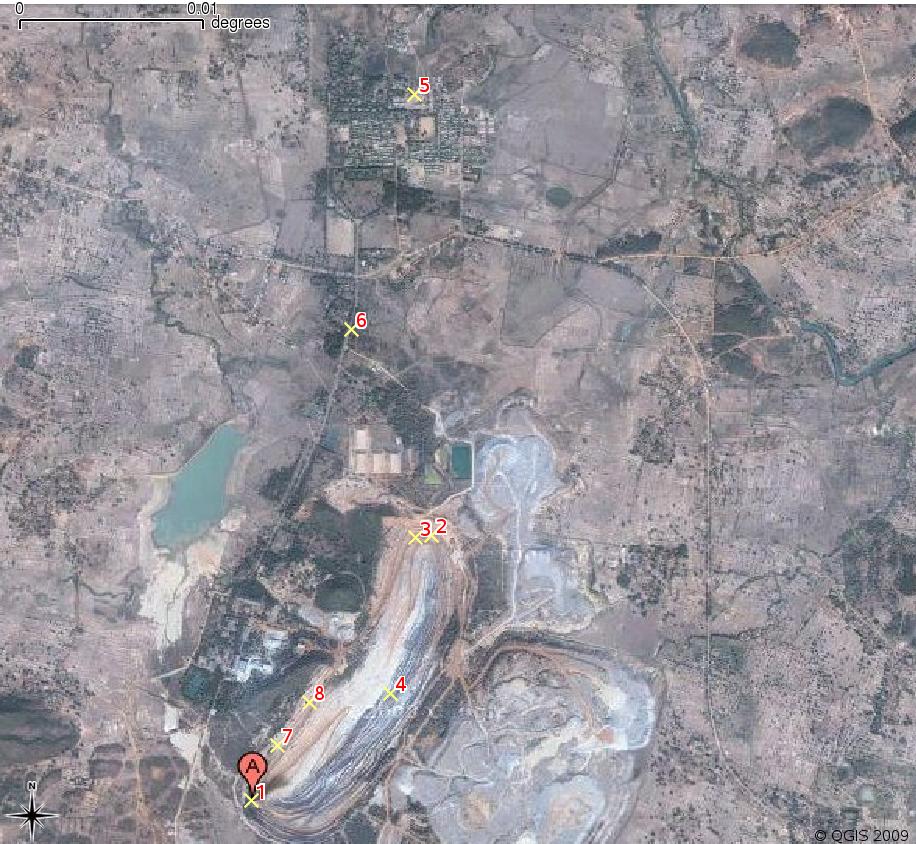
Samples were collected from the pit itself and from adjacent areas
where possible. 8 locations were sampled and are geo-located on this
satellite image. At each location multiple samples were collected to
examine fluid variations on both local and regional scales. The
prefix MJ together with these site numbers is used in the
following diagrams to refer to the sample collection locations.
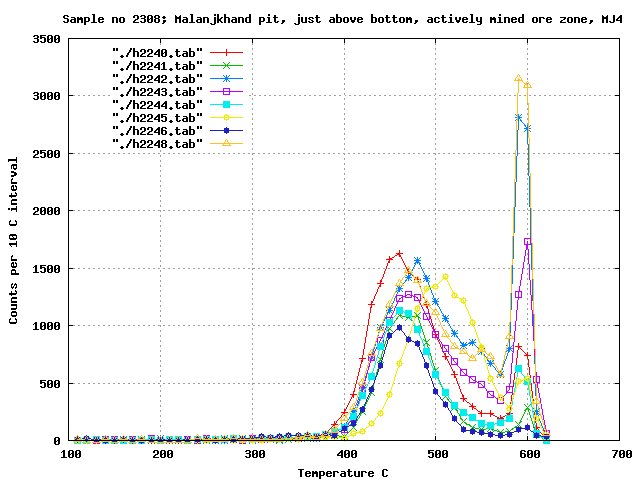
These 8 samples collected at sample location MJ4 on the eastern wall
of the main pit in the ore zone are typical of all the results from
Malanjkhand. There is no low temperature decrepitation indicating
that the fluids are aqueous without significant gas content. Some
differences in the temperature of the decrepitation peak near 450 C
are apparent between samples.
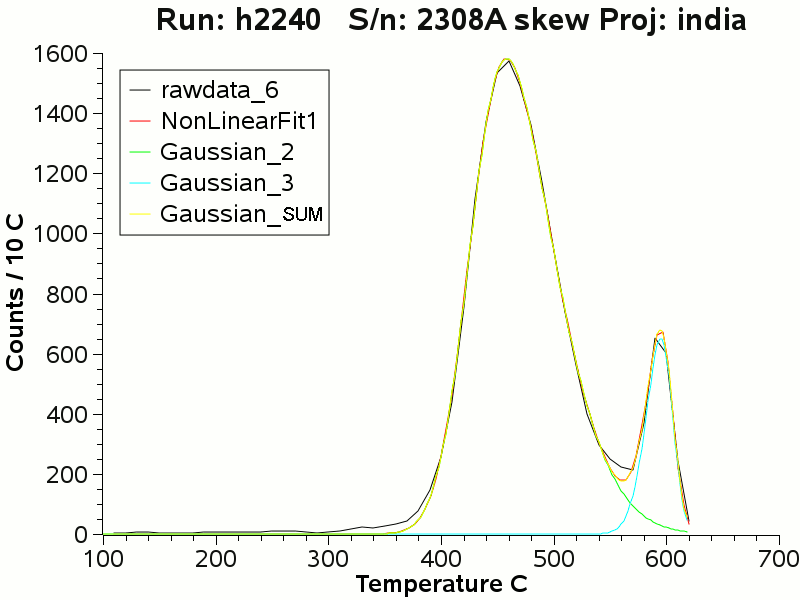
To accurately determine a temperature for each sample to enable
comparison they were all de-convoluted to their component
skewed-gaussian distributions, as described here. The
mode temperature of each peak was used for inter-sample comparison.
This temperature is only approximately related to the homogenisation
and formation temperatures of the sample fluids but it is a
convenient and consistent temperature for comparison of a suite of
similar samples.
In this fit plot, the black line is the raw (smoothed) analytical
data. This has been fitted by 2 gaussian curves in cyan and green.
The yellow curve is the mathematical sum of the 2 fitted
gaussian component curves. The red curve, which is almost completely
concealed beneath the yellow curve, is the regression fit curve
using the Levenberg
-Marquardt algorithm.
Further discussion of the
mathematical fitting methods is here.
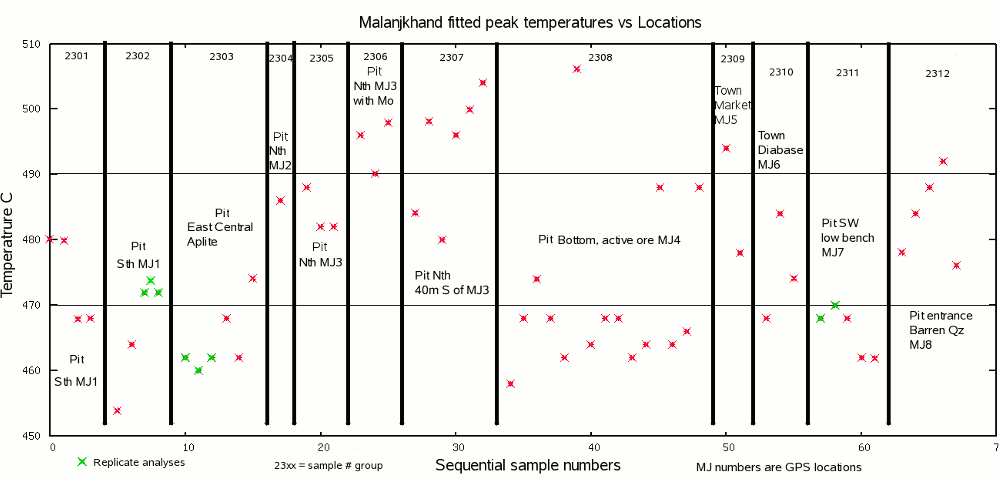
The mode temperatures of the fitted gaussian curves for each
sample are plotted in the diagram below. Samples are in groups
according to their geographic location MJ number. The green
samples are repeat gaussian fits of the same raw data. These
replicate results confirm that the mathematical fit procedure is
stable and robust.
There are significant temperature differences across the pit with
temperatures ranging from 454 to 508 C. Temperatures from the
northern section of the pit tend to be higher than in the south of
the pit. And the active ore zone at location MJ4 also has lower
temperatures.
These temperature variations could be showing zonation within the
ore. Samples from the Molybdenum rich north end of the pit at
location MJ3 show high temperatures as might be expected in a zone
associated with molybdenite deposition.
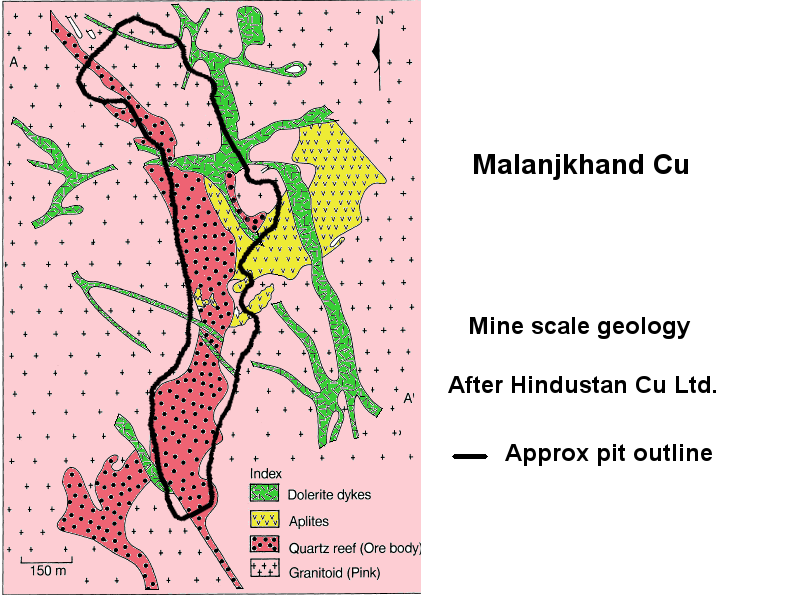
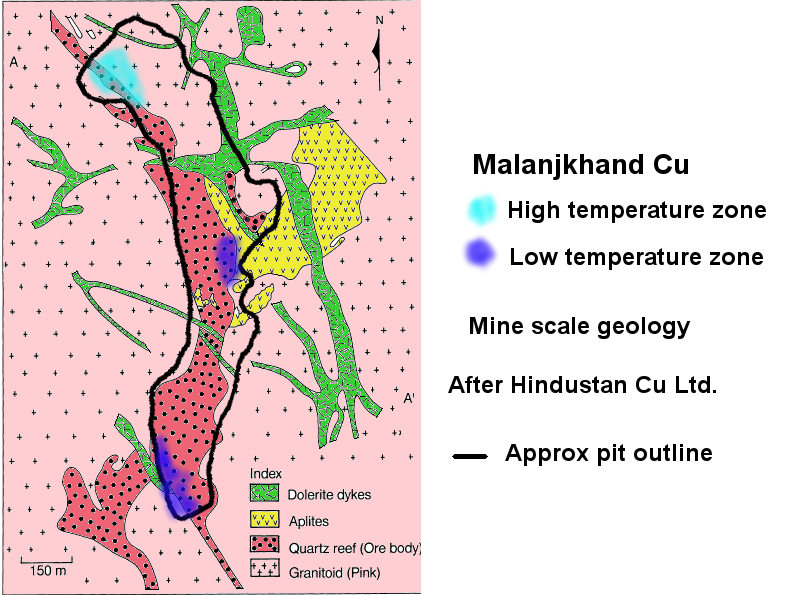
Temperature zonation such as this might be useful in mine scale
mapping. However, there are numerous late stage dykes crosscutting
the pit (refer to the geology map above) which may also be
influencing the temperatures so it is not possible from this data to
be completely certain about the cause of the observed temperature
zonation.
Note that distal background unmineralised samples from the town area
at locations MJ5 and MJ6 have the same temperature as mineralised
samples. Temperatures alone are not diagnostic of mineralisation and
are only meaningful on a carefully collected spatial array of
samples.
The temperature variations from the above plot indicate a
temperature difference across the current mine pit with higher
temperatures at the north end of the pit, where Molybdenite also
occurs, and lower temperatures at the south and central areas of the
pit, although the zonation is indistinct and possibly affected by
overprinting from the later crosscutting dykes. These differing
temperature zones are superimposed on the geology map below.
Microthermometric temperature measurements are too slow, tedious and
subjective to be useful in exploration. However, the baro-acoustic
decrepitation method can be used to determine relative temperatures
for inter-sample comparison on mine scale projects or for detailed
zonation studies.
Conclusions
The gas content (CO2) of fluid inclusions
is a guide to many hydrothermal systems, particularly
mesothermal gold deposits
Highly saline fluids can be used to locate the core
zones of intrusions for porphyry copper and intrusion
related gold exploration
Temperatures of hydrothermal fluids are less useful in
regional exploration but may outline local zonation.
Temperatures alone are not diagnostic as barren and
mineralised quartz frequently form at the same temperatures
Hydrothermal fluids provide a larger and more easily
recognized halo around mineralization than by using
mineralogical or trace element data
Fluid inclusion data easily identifies important
features of hydrothermal fluids which are highly relevant to
mineral exploration
But not all the academic methods are appropriate or
useful in mineral exploration
There are simple methods to measure gas contents,
salinity and temperature which are quick and easy and are
appropriate for exploration application
Microscope observations on crushed grains are easy and
ideal for locating zones of saline fluid inclusions
Baro-acoustic decrepitation provides data on gas
contents and temperature zonation
Excessive un-focused data collection and paranoia
about precision is counter-productive and will conceal the
useful information in an ocean of irrelevant data
 Applied Mineral Exploration