Newest
Topics:
For the latest news, see the NEWEST TOPICS page.
Google is too dumb to let me put the list of news in this column and falsely claims that all my pages are self-duplicates.
Google-NONSENSE
Google's so-called "Artificial Intelligence" is an abuse of the concept of intelligence!
Why CO2-rich inclusions decrepitate at low
temperatures
It has long been recognized that CO2-rich fluid
inclusions decrepitate at quite low temperatures, typically less
than 300 C and sometimes as low as 100 C, giving distinct peaks on
the acoustic decrepigram results. This relationship was first
documented by Burlinson in 1984 : [abstract as a pdf
file] and confirmed by Mavrogenes et
al (1995), who did careful optical abundance measurements of
inclusions and quadrupole mass spectrometric analysis of gases
released from fluid inclusions.
Microscopic homogenisation studies also frequently mention that
they could not obtain a homogenisation temperature for CO2-rich
inclusions
as
they decrepitated before they homogenised. When such decrepitation
temperatures are reported they are in the range of 150 to 300
C, in agreement with the peaks noticed in acoustic
decrepitation data.
To date there has been no clear explanation of why CO2-rich
fluid
inclusions
decrepitate prematurely at low temperatures. However this
premature decrepitation is a consequence of the lack
of condensation of CO2 to a liquid phase at usual
geological PT conditions.
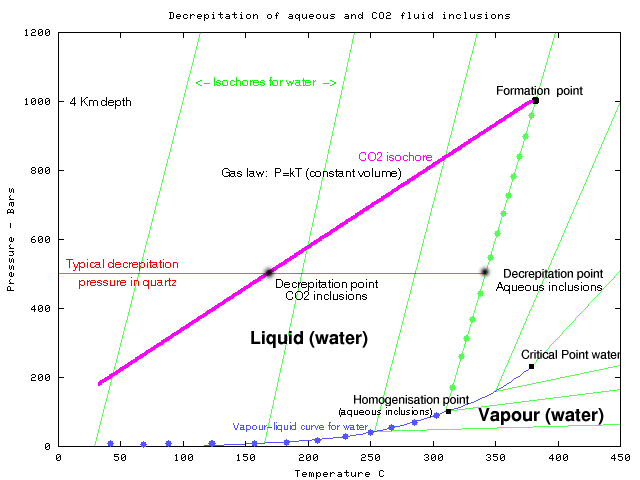
Consider a pair of inclusions formed in quartz at about 380 C
and 1 Kbar pressure. (Shown as the formation point in the
following PT graph). One inclusion is comprised of water (of low
salinity) with no CO2 and the other inclusion is of CO2
with no water. At these conditions the aqueous
inclusion is a liquid and the CO2 inclusion
is a gas, highly compressed and of high density.
As the aqueous inclusion cools, it follows the green isochore (an
isochore is a line of constant density on a PT diagram) down to
the vapour liquid curve at the homogenisation point. It then
nucleates a vapour bubble and on further cooling it follows the
blue vapour liquid curve back to room temperature and pressure,
the volume of the vapour phase increasing and the liquid
phase contracting as the inclusion cools. At room
temperature the internal pressure of the aqueous inclusion is near
zero bars.
In contrast, as the CO2 inclusion cools it will follow
a PT path along the magenta line which is determined by the
gas law, PV/T = k, where k is a constant. As the volume of the
inclusion is constant, this is equivalent to a path of P = k'
T (non-ideal behaviour is minor and can be ignored).
CO2 does not condense to a liquid until below 31
C, its critical point temperature. CO2 inclusions at
room temperature typically have high internal pressures.
(Pressures of at least some 40 to 70 bars are required to give a
liquid CO2 phase at room temperatures below 31
C.)
During cooling from their formation conditions, there is a
confining pressure on the quartz host mineral similar
to the internal pressure of the inclusions, so the inclusions will
not burst. But when observed and heated in the laboratory, the
confining pressure on the quartz host mineral is only 1 bar.
During heating the inclusion conditions follow the same
pathway as when they cooled and soon develop internal pressures
sufficient to break the quartz now that it has only 1
bar of confining pressure. A very approximate estimate of
the overpressure needed to break the quartz is shown by the red
decrepitation pressure line at 500 bars.
In the above graph, the aqueous inclusion will generate little
internal pressure during heating as it progresses up the
vapour-liquid equilibrium curve to the homogenisation point at 320
C. At this temperature the liquid has expanded to fill the
inclusion and there is no longer a vapour bubble. Upon further
heating the inclusion pressure progresses up the green isochore.
The liquid rapidly develops a high internal pressure as it tries
to expand within the fixed volume of the inclusion and by 340 C
has developed enough pressure to burst the quartz host grain. The
observed decrepitation temperature of 340 C is acceptably close to
the original formation temperature of 380 C, and acoustic
decrepitation observations can be used as a reasonable indicator
of the formation temperature.
For the CO2 inclusion, the pressure immediately starts
to increase as it is heated, progressing along the PT line shown
in magenta and by 170 C, in this case, the internal pressure is
sufficient to burst the host quartz grain. The observed
decrepitation temperature of 170 C is a poor indicator of the
formation temperature of 380 C. However, the very low temperature
decrepitation is characteristic of the presence of CO2
rich fluid inclusions and is easily measured using the
acoustic decrepitation technique.
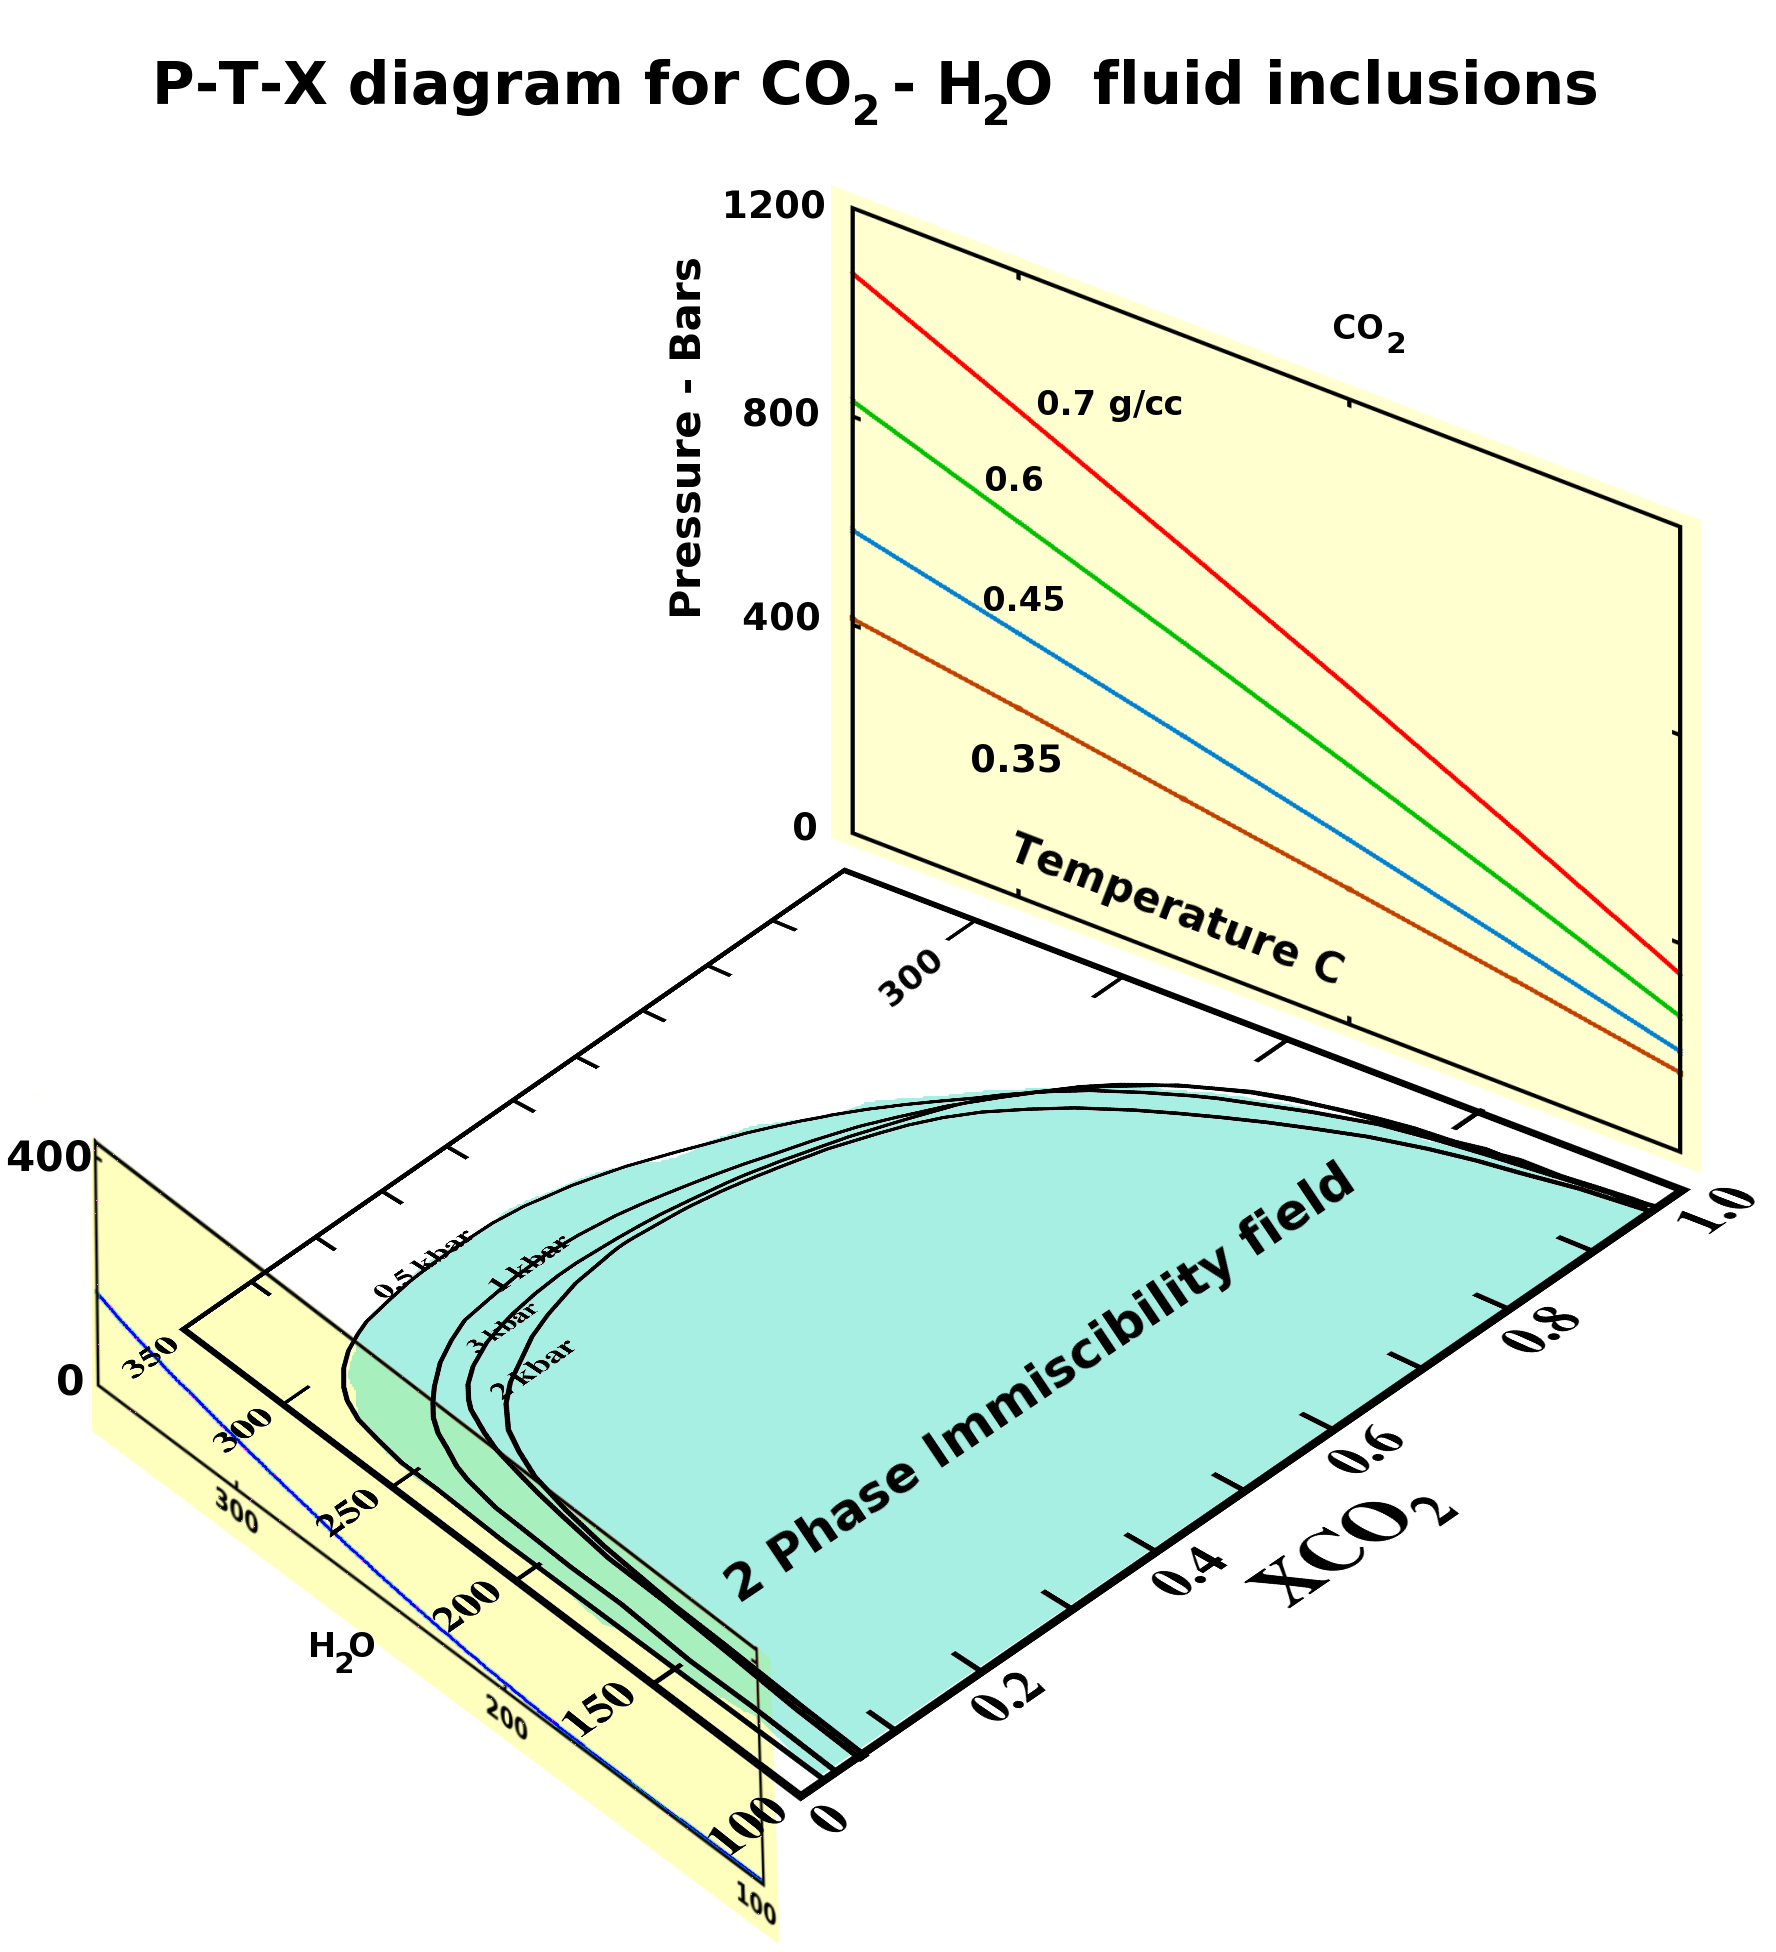
The above diagram is only approximate, but at the formation
point, the density of a pure water phase is 0.7 g/cc while
a pure CO2 phase at this point would
be about 0.6 g/cc and a pure methane phase at this point would
be about 0.22 g/cc.
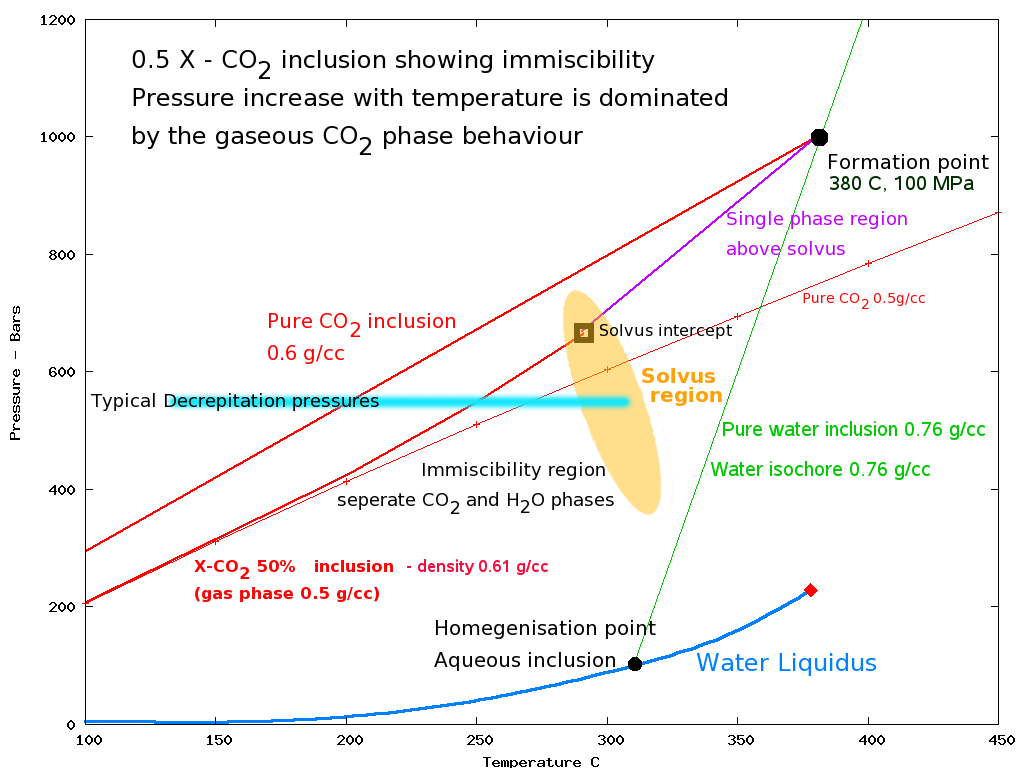
Extrapolation to mixtures of CO2
and
water
Mixtures of CO2 and water within an
inclusion will give results intermediate between these 2 end-point
cases. Precise calculations based on the mole fraction of CO2
present will depend also on the solubility of CO2
in the aqueous phase, and this in turn will depend upon the
salinity of the aqueous phase. However it is clear that as
CO2 is added to an aqueous system the
decrepitation temperature will be lowered, and perhaps
substantially so. It is this lowering of the decrepitation
temperature with the increase of CO2 in the
system that is easily measured by the acoustic decrepitation
method making it a useful exploration tool in finding
interesting hydrothermal systems with significant CO2
-rich fluids. Such CO2 -rich fluid systems are
frequently associated with gold mineralisation as documented by Burlinson (1991), :[Burlinson
full paper as a pdf]Mavrogenes et. al.
and Partamies
& Poutiainen (2001).
The figures here shows that an aqueous - CO2 fluid
inclusion mixture will behave predominantly like a CO2
rich inclusion.
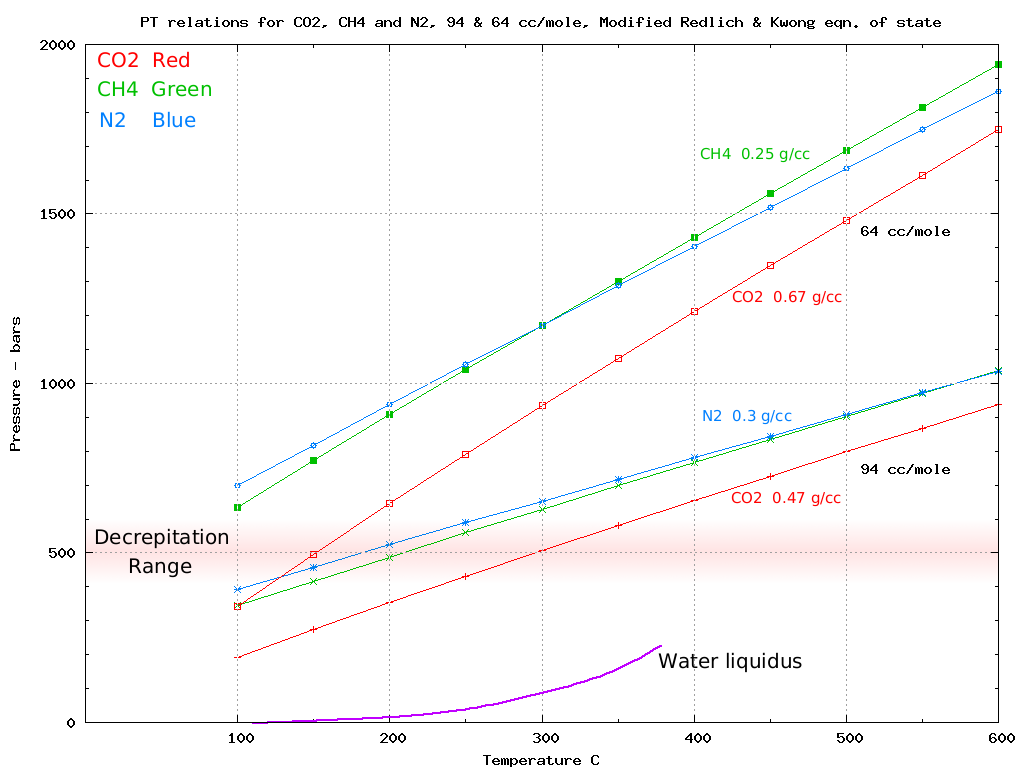
Variations in real geological systems
Pure CO2 fluids are uncommon and most
inclusions contain CO2 and water and
perhaps some NaCl . Methane and nitrogen are less common
additional constituents. The addition of non-condensible gases
such as methane and nitrogen does not change the decrepitation
behaviour, as these gases also follow the gas law equation during
heating and cooling. Different chemical species of gases do not
have different P-T expansion properties. The addition of solutes
to the aqueous phase tends to suppress the solubility of CO2
and so increase its pressure in the gas phase, causing slightly
more lowering of the decrepitation temperatures.
Real fluid inclusions vary greatly in their size and morphology.
This has a major effect on the decrepitation behaviour as large or
angular inclusions can more easily break the host quartz grain.
While aqueous inclusions are often 5 to 20 microns across and
somewhat rounded, it is common for CO2 -rich inclusions
to be quite large (50 or more microns) and extremely irregular
with sharp points. The stress concentration at these points on the
inclusions makes it much easier to break the host quartz grain.
This accentuates the lowering of decrepitation temperature by CO2
-rich fluids as they may be able to decrepitate at, say, 300 bars
overpressure instead of 500 bars.
If the inclusions are formed at low pressure (epithermal
environments), they may not decrepitate at all. In the above
scenario, an aqueous inclusion formed at 400 bars would need to be
heated a little past its formation temperature before it develops
enough internal pressure to burst. However, a CO2
inclusion formed at 400 bars may never develop enough internal
pressure to burst at all. And low density water inclusions
("steam") may homogenize to a vapour phase instead of a liquid and
these would never develop enough internal pressure to decrepitate.
This agrees with decrepitation measurements on high level systems
in which it has been found that decrepitation is rare or absent.
This figure shows that the behaviour of various gases are all very
similar as they all approximately follow the ideal gas law, as explained here.
Implications
Inclusions containing methane or nitrogen instead of CO2
will behave just like CO2 inclusions, so long as they
formed at high pressure. All gases follow approximately the same
PT expansion path as CO2 . There may however be some
mitigation of the decrepitation if inclusions of these other
gases are morphologically different to CO2 inclusions.
From the above discussion, acoustic decrepitation should be
applied with caution to high level epithermal systems and
"steaming haloes" in which the formation pressures are very low or
the depositional fluid was water vapour rather than liquid
water. Deposits formed under boiling conditions would
probably only show decrepitation from the liquid phase of the
system and not from the vapour/gas phase unless it boiled at very
high pressures.
Unresolved issues
There have been claims that methane rich inclusions do not give
an acoustic decrepitation response. Such claims are
misleading. Typically the formation pressure or density or
detailed fluid description of these inclusions is unstated so it
is impossible to resolve the controversy. But in some cases (e.g.
the Tanami goldfields,
NT, Australia) an author has claimed to have found
"methane-rich" inclusions formed at high pressures and no
low-temperature acoustic decrepitation was observed.
Although I do not have access to formation pressure information on
those samples, the whole province is claimed by the same authors
to have formed at considerable depth - at least meso-thermal. A
few samples from the Western Australian Archaean lode gold
deposits with claimed methane rich inclusions also failed to
decrepitate below 300 C.
The theory cannot be reconciled with these claimed
observations. The cause of this apparent contradiction is
incorrect description of the fluid inclusions during
microscopy. (Confirmed by discussions with the authours of
the Tanami data above.) Although the Tanami region inclusions are
described as "methane rich", they are actually water rich, with a
methane rich vapour phase. However, the vapour phase is
volumetrically small and the molar proportion of methane in the
inclusion as a whole is miniscule. It is grossly incorrect to call
such inclusions "methane rich", they are in fact ordinary
aqueous inclusions, with traces of methane present. Hence their
overall decrepitation behavior is that of an aqueous inclusion
and they will not exhibit any anomolous low-temperature
decrepitation. Other possible causes include the use of
leaked or decrepitated inclusions in the microscopic work, or
reaction between CO2 and methane to give graphite and
water post-entrapment. Methane cannot behave significantly
differently to CO2 - they both obey the gas law!
Conclusions
Acoustic decrepitation is an easy and rapid way to determine the
presence of CO2 -rich fluid inclusions in mesothermal
environments. The actual decrepitation temperature measured gives
a vague idea of the mole fraction of CO2 present
- though there are several complicating factors.
For aqueous inclusions, the decrepitation temperatures can be
used as an approximate indicator of the formation temperatures.
This is a far easier and faster way of determining formation
temperatures on samples than is microthermometry, which can then
be used sparsely as a control on the decrepitation data rather
than as a primary measurement method.
The decrepitation data can also be used as a "reality check" on
microscopic observations. In particular it is apparent there are
some problems with some of the data on methane rich inclusions
reported in the literature. Cases have also been seen where
microthermometry was inadvertently performed on secondary
inclusions and this error was quickly isolated using the
decrepitation results.
 Applied Mineral Exploration