Newest
Topics:
For the latest news, see the NEWEST TOPICS page.
Google is too dumb to let me put the list of news in this column and falsely claims that all my pages are self-duplicates.
Google-NONSENSE
Google's so-called "Artificial Intelligence" is an abuse of the concept of intelligence!
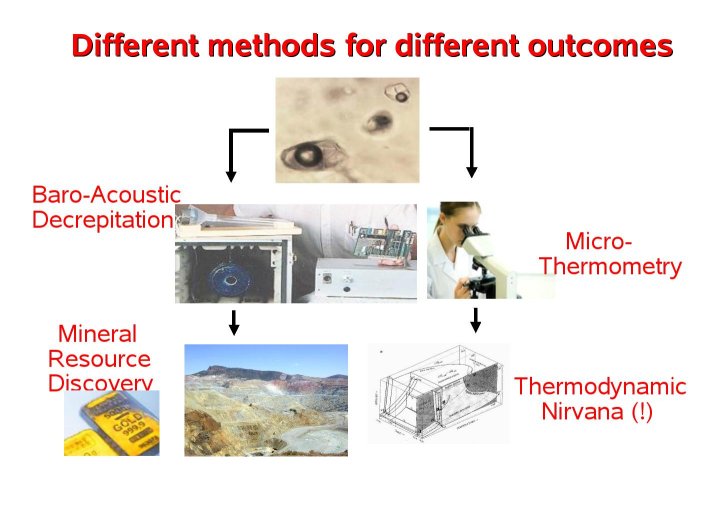
An explanation of the baro-acoustic decrepitation method
Presented by K. Burlinson at the ACROFI-2 conference, Kharagpur, India, 2008
The Acoustic decrepitation method was first used in Canada in the late
1940's. As microthermometric methods improved, the decrepitation method
lost favour because the microthermometric results were more precise.
However, the decrepitation method was not well understood at this time
because the thermodynamics of fluids in inclusions was not known and,
critically, there was little or no understanding of the importance of CO2
rich fluids within mineralising hydrothermal fluid systems. With our
better current understanding of hydrothermal fluids and thermodynamics, it is now apparent
that the baro-acoustic decrepitation method is very useful as a mineral
exploration method. Despite being a little less accurate, decrepitation
can provide rapid and cheap analyses on large numbers of samples much
more easily than using microthermometric methods and provides fluid
information which is very useful during mineral exploration.
The acoustic decrepitation analysis procedure does not require the preparation of a thin section or use of a microscope and consists of these steps:
Crush and sieve the sample - NO THIN SECTION!
Heat the sample at 20 C per minute
The inclusions develop high internal pressures and burst (decrepitate)
Detect the pressure pulses
Process and count the decrepitation events in the attached computer
Plot the results as a histogram of inclusion counts versus temperature
No microscope work is required!
In mineral exploration, the understanding of the CO2 content
of hydrothermal fluids is very useful to locate economically
interesting targets. The decrepitation method is a rapid way to measure
the CO2 contents of samples.
Gas rich inclusions give prominent low temperature decrepitation counts
This decrepitation is independent of the types of gases present (CO2, CH4, N2)
CO2 is the most common constituent which causes this low temperature decrepitation
Hence acoustic decrepitation is a quick method of determining the presence of CO2 rich fluid inclusions to target economically interesting mineralized zones.
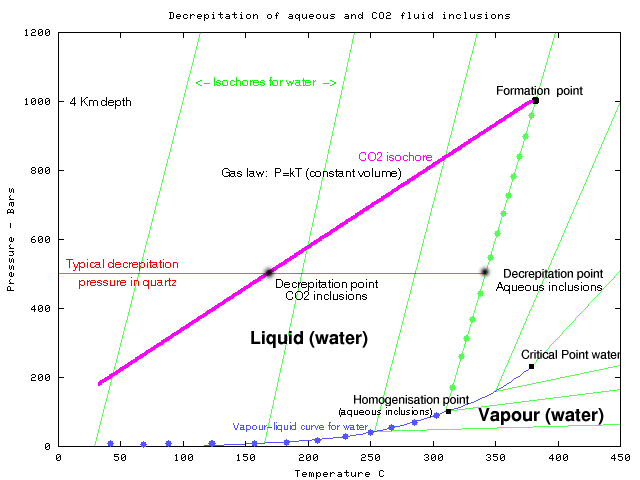
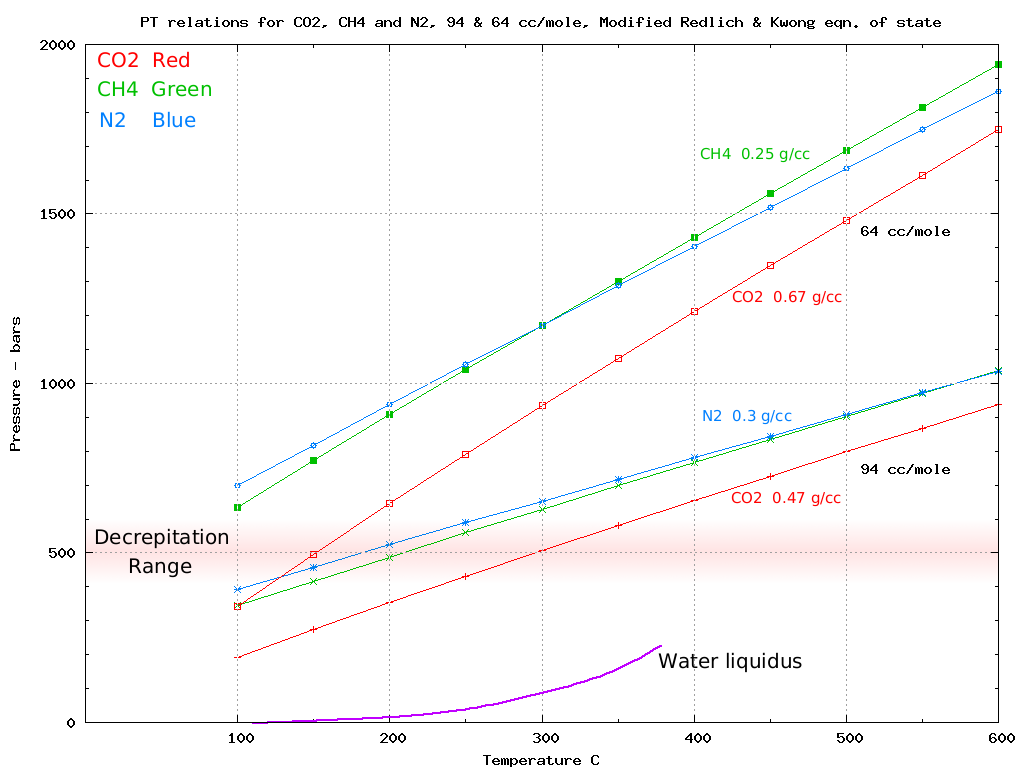
To explain the low temperature decrepitation of gas rich fluid inclusions, consider this PT diagram
Consider 2 fluid inclusions formed at 380 C and 1 Kbar pressure (the Formation point on this graph), one inclusion being pure CO2 and the other pure H2O.
After cooling to room temperature the CO2 inclusion will
retain a high internal pressure and when heated it will rapidly develop
a high internal pressure and decrepitate at about 160 C. Its P-T path
is along the magenta line, which is determined by the gas law of
thermodynamics.
The H2O inclusion, when cooled to room temperature, will
consist of a liquid with a vapour bubble at negligible internal pressure and will not develop much
internal pressure until it is heated above the Homogenisation point
(310 C in this example). It will not develop enough internal pressure
to cause decrepitation (about 500 bars) until about 340 C, the
decrepitation point of aqueous inclusions. Its P-T path is along the
blue "vapour-liquid curve for water" and then along the green isochore
after homogenisation.
So despite forming at the same pressure and temperature, the CO2
inclusions will decrepitate at much lower temperature than equivalent
aqueous inclusions and this behaviour means that acoustic decrepitation
can be used to determine the presence of CO2 rich fluids.
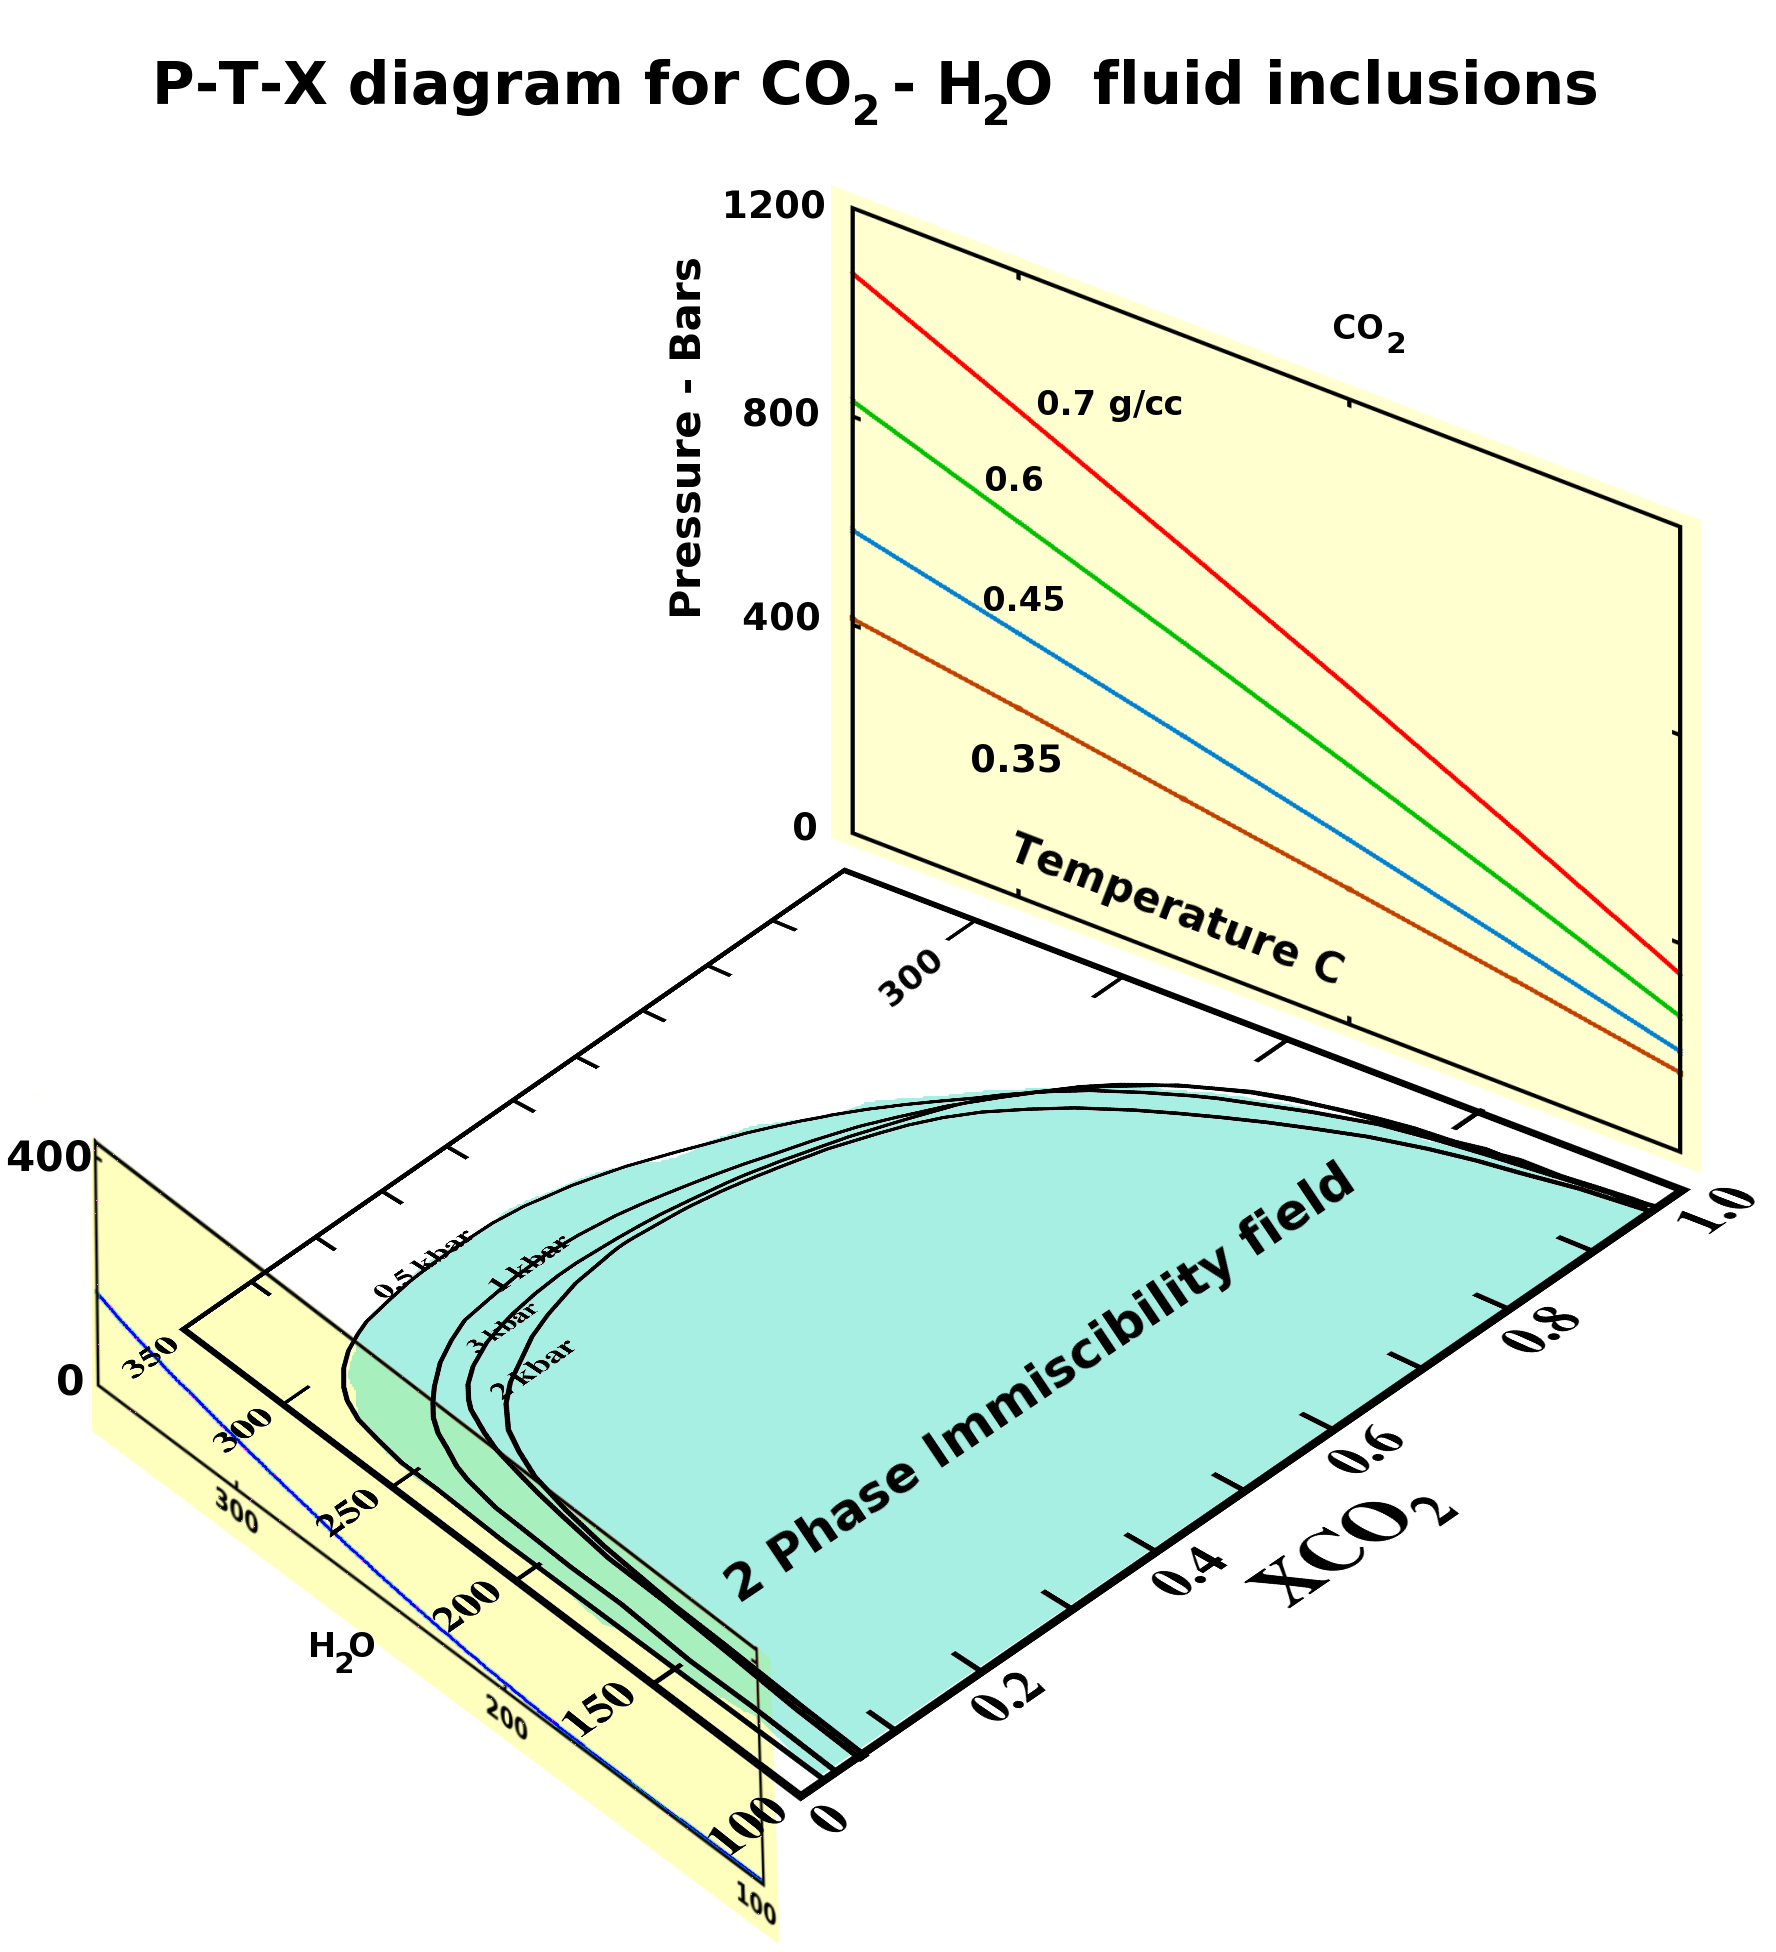
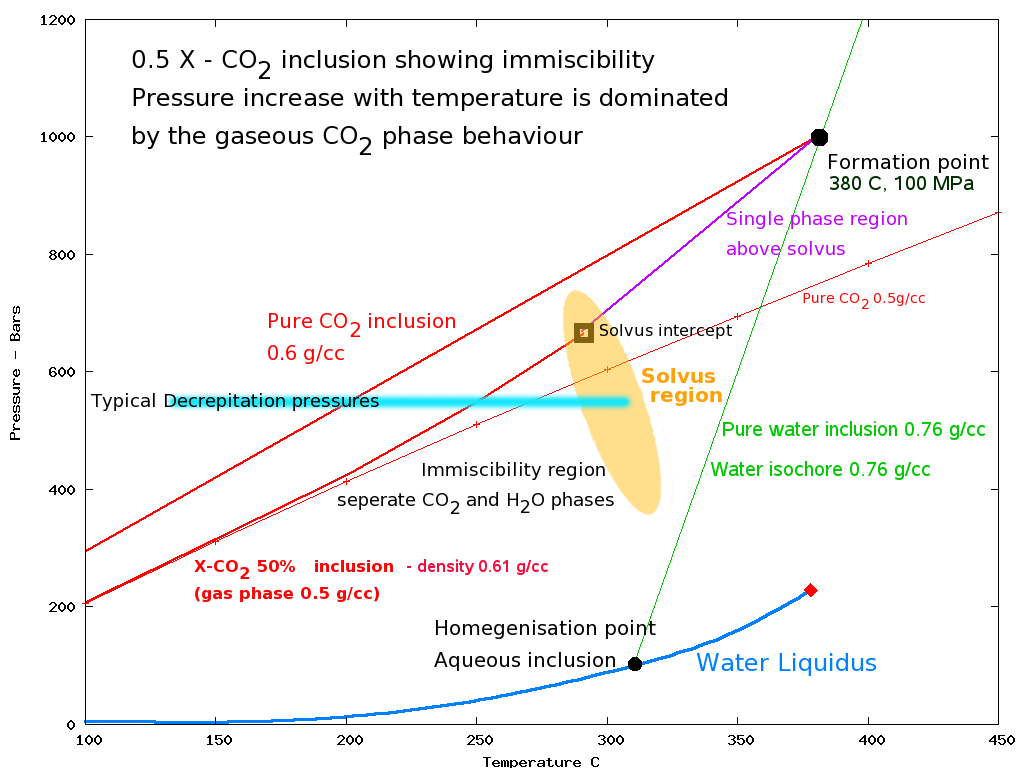
Mixtures of CO2 and H2O are immiscible at low
temperatures and will separate into 2 component phases. The gas phase
will dominate the internal pressure of the inclusions and gas-water
mixtures will behave much like gas rich inclusions but with lower fluid
density.
Fluid inclusions containing gas - water mixtures decrepitate much like gas rich fluid inclusions.
Because the P-T behaviour of gases is given by the gas law and is
independent of the gas molecule species, decrepitation is similar for
all gases.
These P-T plots are calculated from the equation of state formulae for 3 common constituent gases in fluid inclusions.
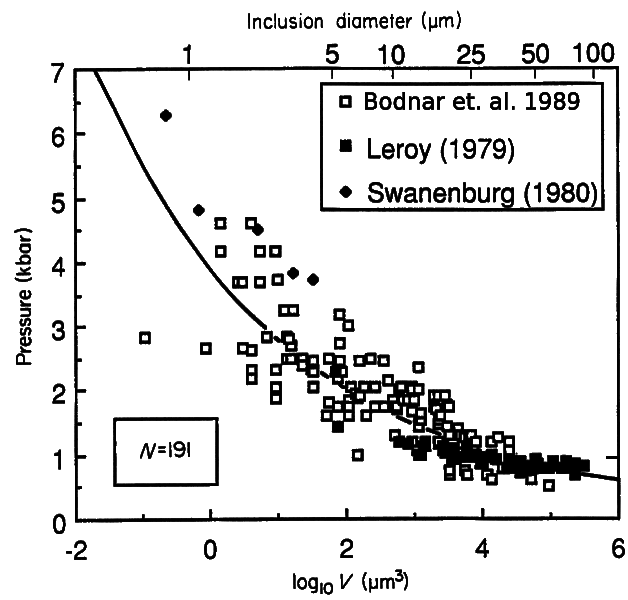
The decrepitation of fluid inclusions is dependent upon the size and
morphology of the inclusions and very small inclusions probably do not
decrepitate.
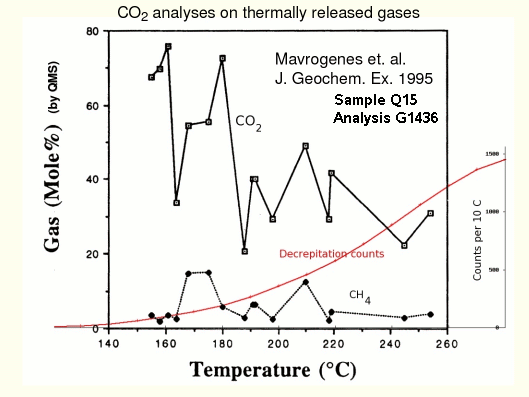
Mass spectrometer analyses of gases released during thermal decrepitation show large amounts of CH4 and CO2 released at low temperature, corresponding with the low temperature baro-acoustic decrepitation peak.
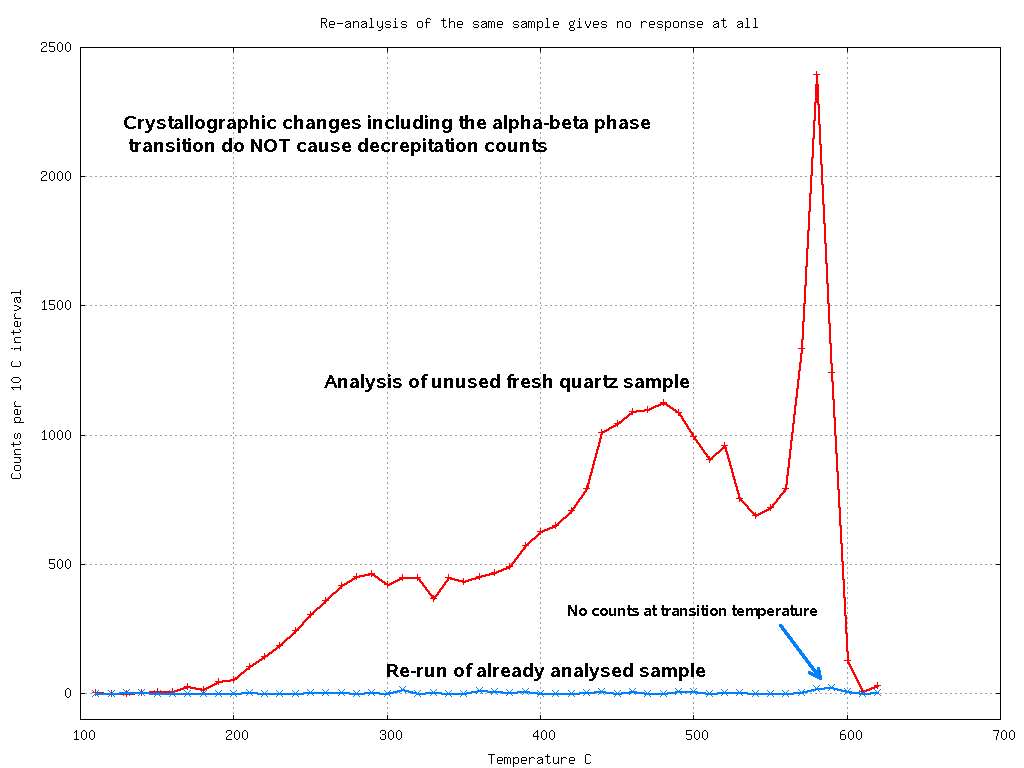
The decrepitation counts are only caused by pressure pulses as fluid
inclusions burst open and are not caused by crystallographic effects,
as shown by the absence of decrepitation on a sample which is heated
for a second time. There is no response at the quartz alpha-beta phase
transition temperature of 573 C in the reheated sample despite the fact
that this phase change cannot be quenched.
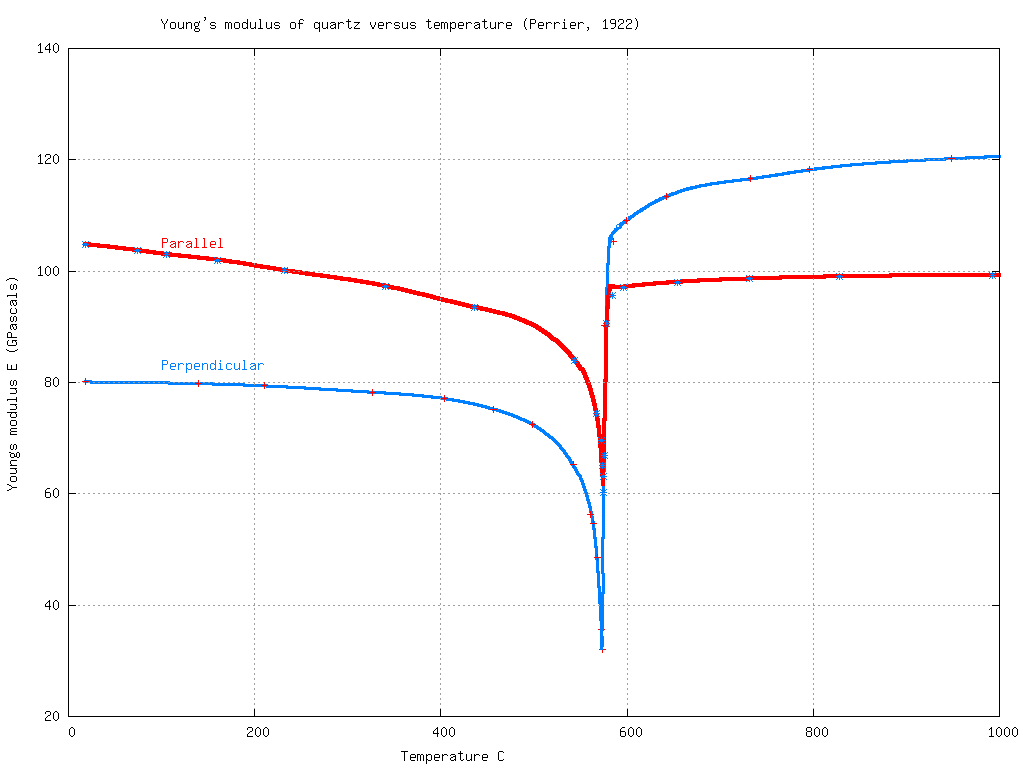
Decrepitation counts occur at the quartz phase transition temperature
in fresh samples because the strength of quartz, as measured by its
Young's modulus, decreases dramatically at the phase transition
temperature and this allows small inclusions to decrepitate because of
the weakening of the quartz host mineral. Parallel and perpendicular
refer to the direction of measurements relative to the c axis of the
quartz.
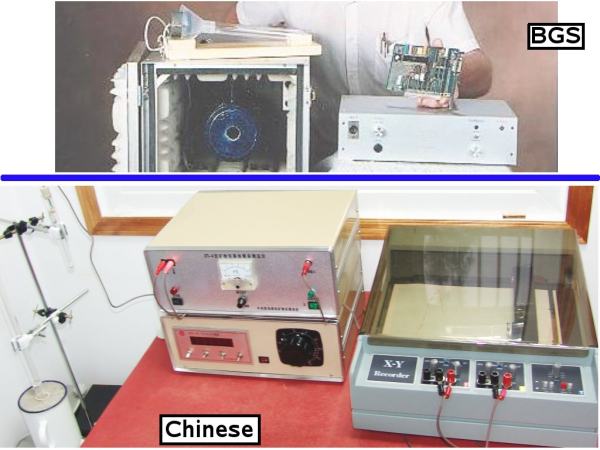
Two different instruments have been used to analyse the same quartz
standard sample and both instruments give the same analytical result.
The upper instrument in this picture is the BGS model 105
decrepitometer as used in Darwin. The lower instrument is operated by
professor Xieyihan in Beijing.
The instruments are electronically completely different. The BGS
instrument is completely digital and is operated by an attached
computer (not shown), while the Beijing instrument used entirely
analogue electronics.
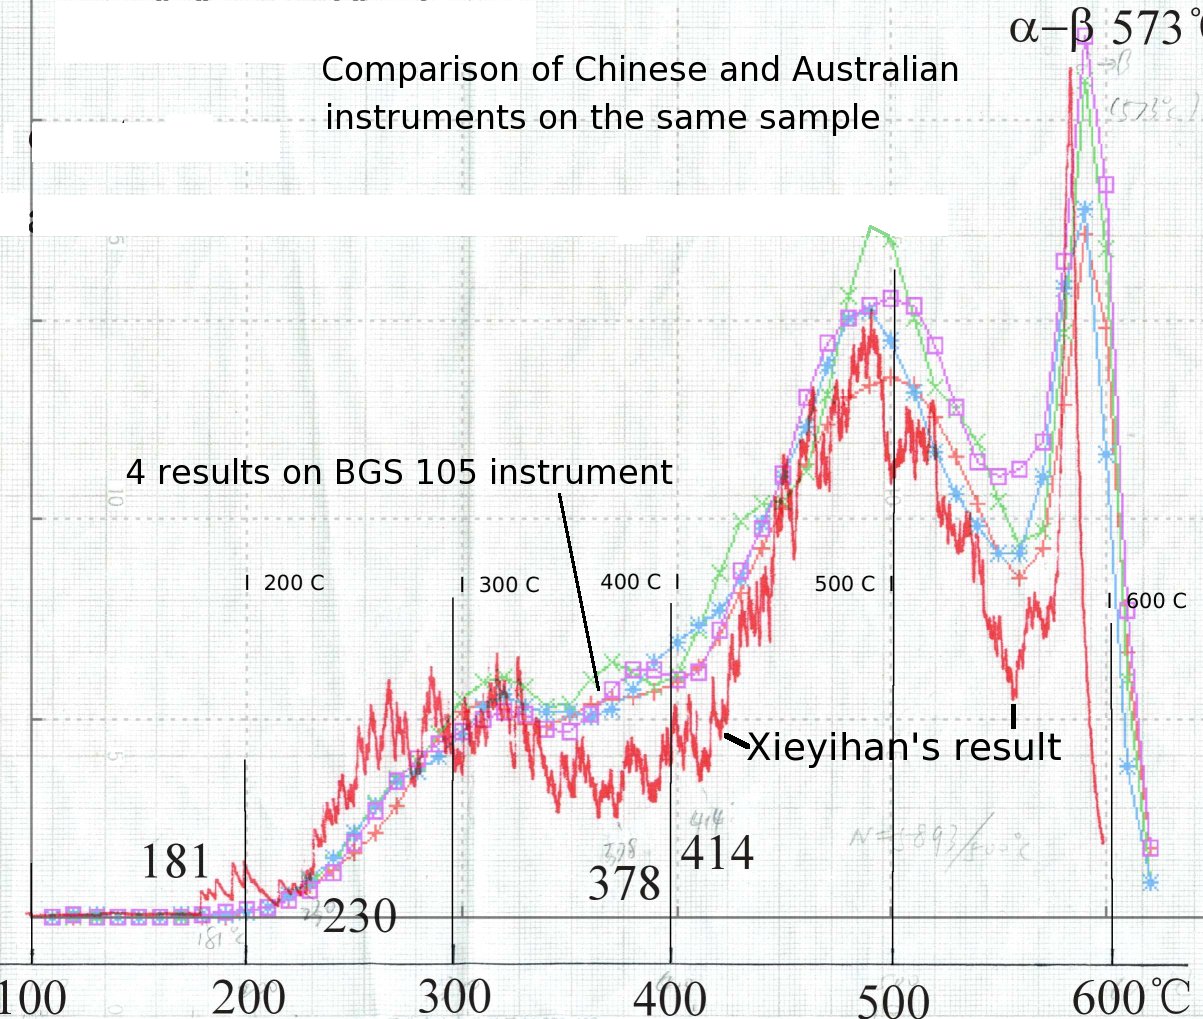
Both instruments give the same result on the standard sample despite
their vastly different electronics and 2 different instrument operators.
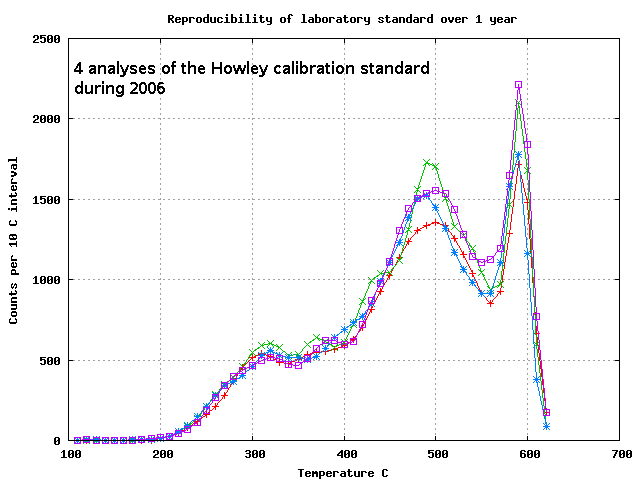
Regular re-analyses of the calibration standard sample shows that the instrument reproducibility over time is good.
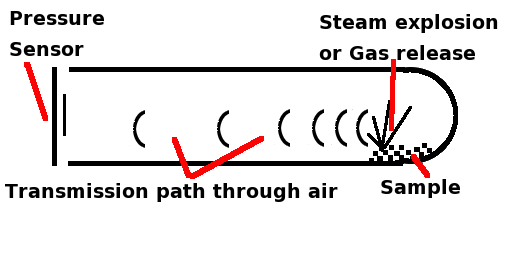
The instrument ONLY detects PRESSURE changes.
Crystallographic changes in the sample generate shear waves which
are not detected as they cannot travel through the airpath in the
instrument and are not detected by the pressure sensor.
Only steam explosions or gas release as fluid inclusions decrepitate can be detected by the pressure sensor and counted.
Acoustic decrepitation ONLY responds to fluid inclusions.
Updated Understanding:
Gas rich fluid inclusions give distinct low temperature decrepitation responses.
Baro-acoustic decrepitation is caused by fluid inclusions and NOT by crystallographic effects in the host mineral.
CO2 is released during low temperature thermal decrepitation.
Inclusion decrepitation is facilitated at 573 C in quartz by the
drastic reduction in the Young's modulus of quartz as it passes through
the alpha-beta phase transition.
The alpha-beta phase transition in quartz does not generate decrepitation counts in the absence of fluid inclusions.
Baro acoustic decrepitation gives reliably reproducible results
with different instruments and operators and over extended time
intervals.
Inclusion Abundance Measurements
To investigate the proportion of inclusions which decrepitate during
heating, inclusion counts were carried out on thin sections of several
samples for comparison with the decrepitation curves from the same
samples.
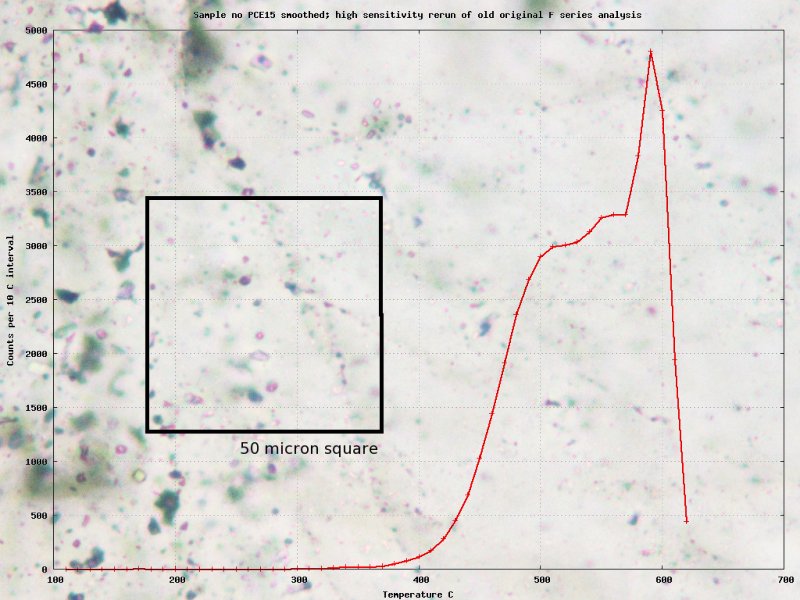
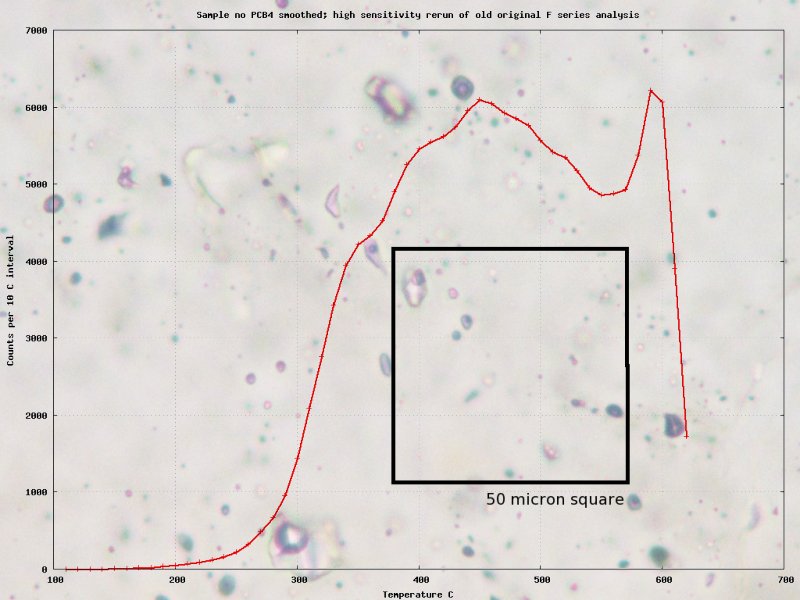
The area of thin section counted was a square 50 microns by 50 microns.
Using a 40* objective, the depth of field of view was measured to be 5 microns
This gave a volume counted of 12.5 * 10-6 cubic millimetres.
Multiply the counts by 1.54 * 107 to get the number of inclusions per half gram, the quantity used in the decrepitation analysis.
No attempt was made to separate primary and secondary inclusions, all visible inclusions were counted.
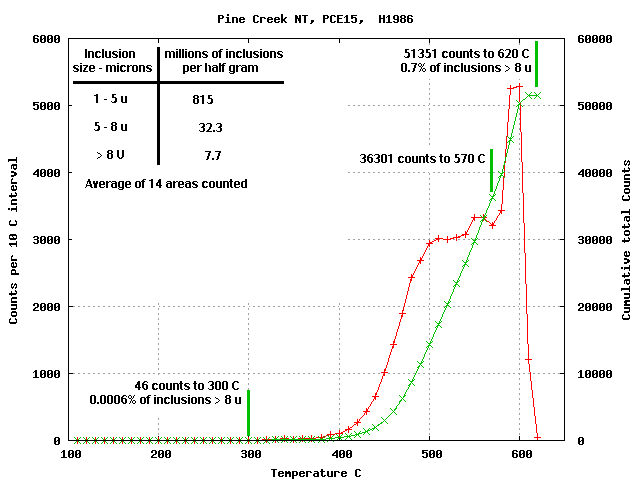
Sample PCE15
The counts and decrepitation for this sample are:
(interval counts in red: cumulative counts in green)
Just less than 1% of the observed inclusions > 8 microns were detected during decrepitation.
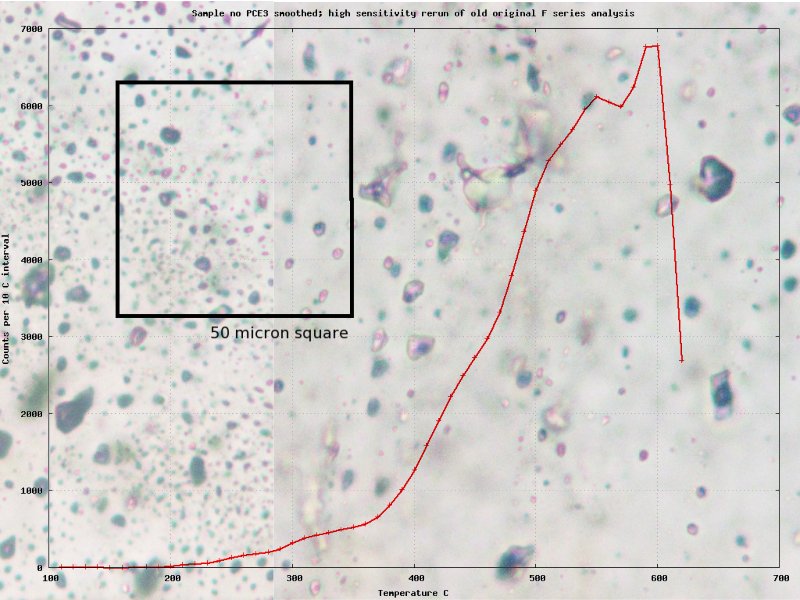
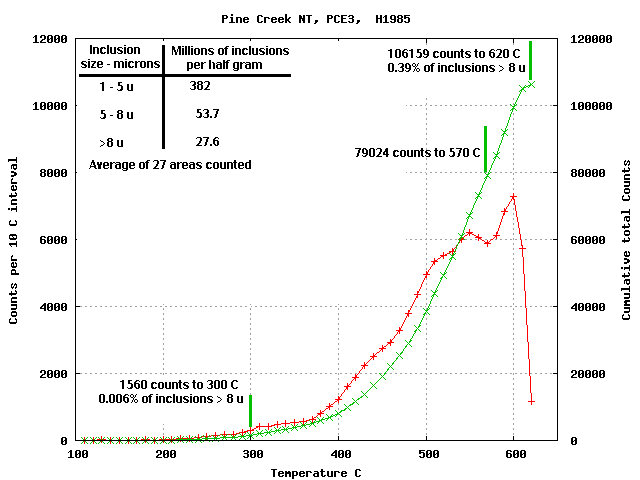
Sample PCE3
The counts and decrepiation for this sample are:
(interval counts in red: cumulative counts in green)
Only 0.4% of the inclusions > 8 microns were detected during decrepitation.
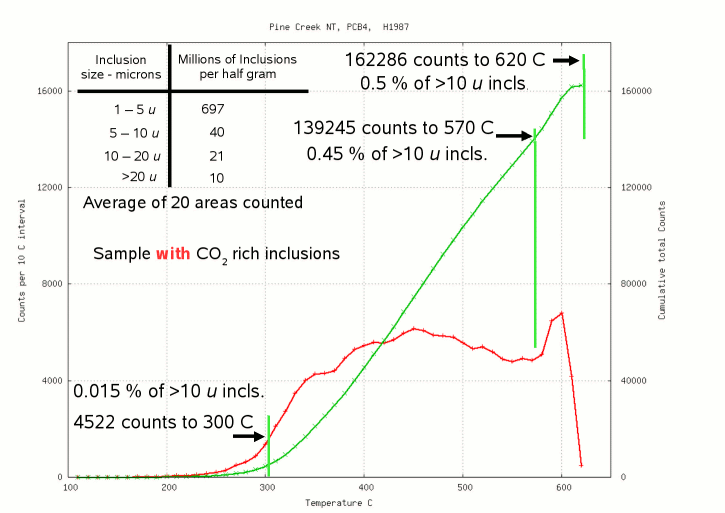
Sample PCB4
The counts and decrepiation for this sample are:
(interval counts in red: cumulative counts in green)
Only 0.5% of the inclusions > 10 microns were detected during decrepitation.
Most fluid inclusions do not decrepitate and quartz can apparently
withstand fluid inclusion with internal pressures of several kilobars.
Although the decrepitation method detects only a small proportion of
the total number of inclusions in a samples, the results are
consistently reproducible on multiple analyses of the same sample. And
decrepiation still detects and counts a vastly greater number of
inclusions per sample than is ever achieved during microthermometric
studies, so the decrepitation data is far more statistically robust.
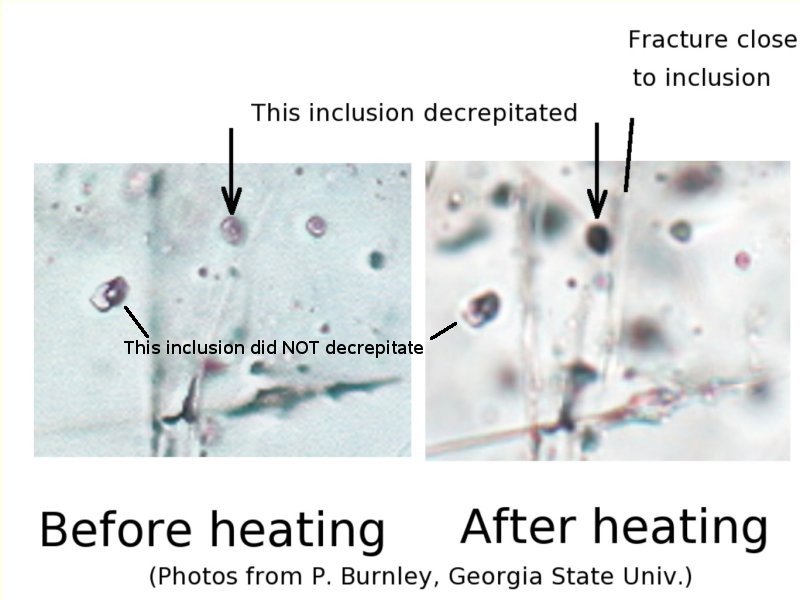
In addition to the effect of inclusion size upon decrepitation,
the stress regime in the host mineral will control which inclusions are
able to decrepitate. These comparison photographs of the same sample
are before and after thermal cycling shows that an inclusion close to a
plane of weakness in the host mineral has decrepitated, but nearby
larger inclusions have not decrepitated because they were distant from
a plane of weakness in the quartz host mineral.
Conclusions:
Decrepitation counts are caused by pressure pulses as gas is released from fluid inclusions during heating.
Decrepitation is not caused by crystallographic changes in the host mineral
Decrepitation easily detects gas rich inclusions regardless of the actual gas species present.
Decrepitation counts an enormous number of inclusions per sample, giving statistically robust and valid results.
Analyses on different instruments with different operators are consistent and the method is robust and stable.
Decrepitation gives objective and consistently reproducible results. It is independent of bias during microscope observations.
This is despite the rather low decrepitation efficiencies
when compared to the total abundance of inclusions in the samples.
Why use baro-acoustic decrepitation? Because it is the most
appropriate fluid inclusion technique for use in mineral exploration.
Different procedures are appropriate for different outcomes.
Microthermometry is appropriate for mineral deposit genesis study, but
too slow and cumbersome for mineral exploration. Baro-acoustic
decrepitation gives rapid and reliable data with quick sample
turn-around and is the preferred method to apply fluid inclusion
measurements to mineral exploration programmes.
 Applied Mineral Exploration